Technical Analysis 101: How To Read Charts & Identify Trends
Technical analysis gives traders clues about what the future may hold. Learn how to apply this study to your own investing strategy today!

Daniel Anderson
Editor, The Money Maniac
Updated February 19, 2023
Originally October 11, 2022 · 12 min read
If you could have any investing superpower, what would it be? X-ray vision to spot the hottest stocks? Or, the ability to travel back in time and buy Apple or Microsoft shares for pennies on the dollar? Technical analysis may not quite give you those abilities, but it can help you get an edge on the market.
By reading charts and identifying trends early, technical analysts can almost peer into the future of the stock market. To learn how this style of analysis works and how to apply it to your own investing, read on!
What is technical analysis?
Technical analysis is the study of price action in financial markets. Technical analysts study past market data, primarily price and volume, via charts and statistical indicators. These tools are used to forecast future price movements and evaluate potential investments.
Principles of technical analysis
There are three key principles that technical analysts rely upon to evaluate securities:
1. The market discounts everything
Technical analysts believe that all public and relevant information is reflected in the price of a stock. This includes macro factors like economic conditions, geopolitical risk, and interest rate policy. It also includes micro factors like company earnings, insider buying and selling, and analyst ratings.
As soon as new information becomes available, it is immediately incorporated into the stock price. Because the market already reflects all of this information, there is no competitive advantage in performing fundamental analysis. In many ways, this school of thought mirrors the Efficient Market Hypothesis.
2. History repeats itself
Technical analysts believe that market behavior repeats itself. Because the “market” is not some independent third party, but rather a collection of individual investors, it is susceptible to human psychology. For this reason, many of the same biases, emotions, and motivations that drove past market behavior will continue to do so in the future.
Technicians use this idea, referred to as behavioral finance, to predict future market prices based on previous price charts and volume data. Even stock charts that are decades old are still viewed as valid points of comparison.
3. The trend is your friend
Technical analysts believe that price trends, whether upward or downward, tend to persist. This principle is based on the concept of momentum, which states that once a stock starts moving in a certain direction, it is more likely to continue moving in that direction than it is to reverse.
In conjunction with market psychology and technical indicators like support and resistance levels, technicians use this principle to identify entry and exit points. Oftentimes this means “riding the trend” by buying stocks that are rising and selling stocks that are falling.
Technical analysis vs fundamental analysis
Technical analysis and fundamental analysis are the two main schools of thought in the financial world. Whereas technical analysts focus on past market data to predict future prices, fundamental analysts focus on company-specific investment metrics like revenue, earnings, and assets.
The debate between technical analysis and fundamental analysis is a long-standing one. Technical analysts argue that all publicly available information is reflected in the stock price, so there’s no need to look at company financials. Fundamentalists counter that technical analysis only looks at stock price data, which doesn’t tell the whole story.
The reality is that these two types of market analysis do not have to be mutually exclusive. On Wall Street, technical analysis tends to be associated with trading and short-term price moves. And fundamental analysis, on the other hand, is used by valuation professionals to spot long-term opportunities. But many successful investors consider both technical and fundamental analysis before an investment decision.
Fundamental analysis involves evaluating a security’s price based on the quality of the underlying business. This requires looking at factors like earnings, margins, dividends, growth, and debt levels. These criteria can be used to narrow a universe of stocks down to a select few that may be worth trading.
Technical analysis can then be layered on top of fundamental analysis to time the entry and exit points. Technical indicators can be used to predict short-term price movements and help confirm whether a stock is in an up or downtrend. By analyzing the stock’s chart patterns over various time frames, investors can use technical analysis to limit risk and maximize returns.
Popular technical analysis indicators
Technical analysts use a variety of indicators to analyze price data and identify trading opportunities. Some of the most popular technical indicators include:
Candlesticks
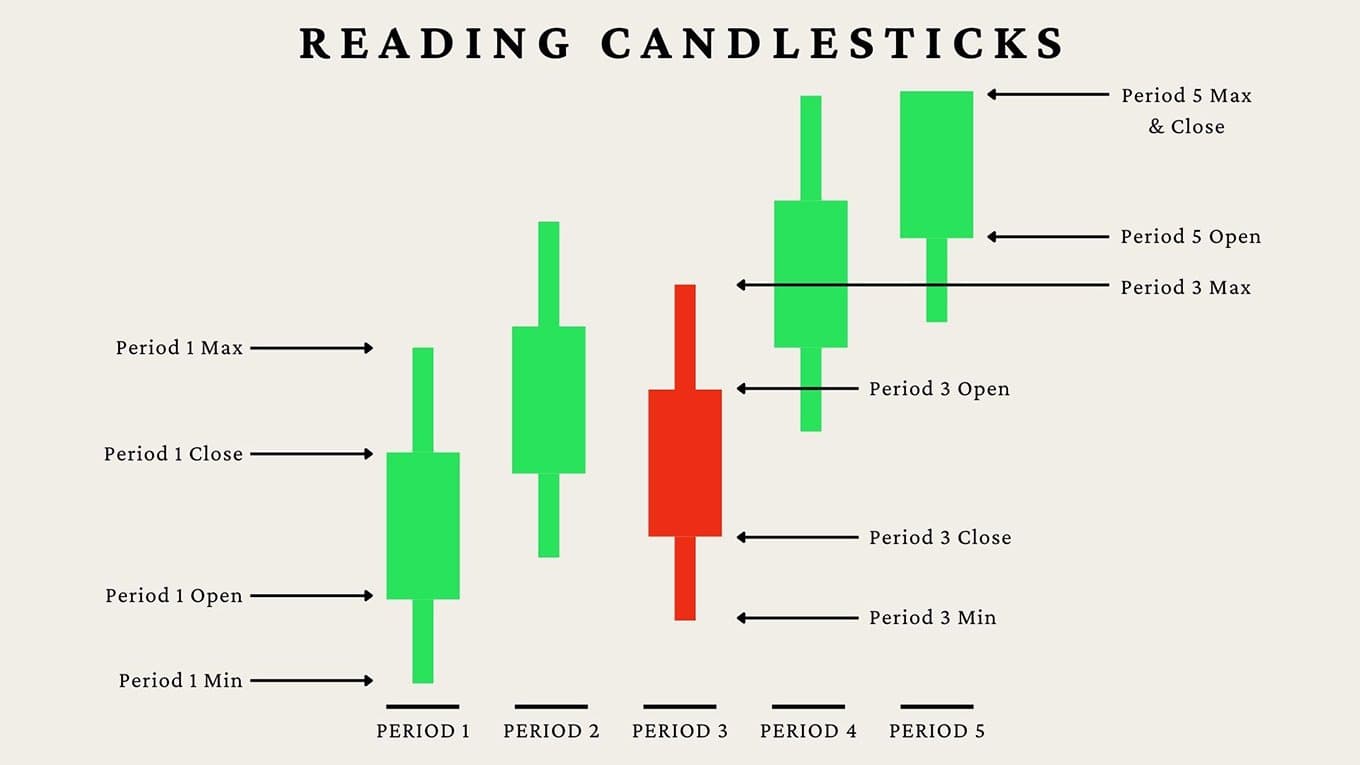
While not technically an indicator in and of themselves, candlesticks are a popular way to visualize price data. Candlesticks provide a clear and easy-to-understand picture of stock price movements over time, which is helpful for both novice and experienced traders.
Candlesticks are composed of a “body” and one or two “wicks.” The body is the portion of the candlestick between the open and close price, while the wicks are the portions above and below the body that represent the highest and lowest prices reached during the trading period.
Candlesticks can be used to identify patterns like reversals, continuations, and breakouts. For example, a candlestick with a small body and long wicks at the end of a downtrend is called a “hammer” and is often seen as a bullish reversal pattern.
Support and resistance
Support and resistance levels are price points where the stock has historically had difficulty breaking through. These levels can be used to identify entry and exit points, as well as potential trend reversals.
Support levels are created when the stock price has fallen and then “bounced” higher. This bounce indicates that there is buying interest at these lower levels. Once the stock price breaks below support, it is often seen as a bearish sign.
In theory, this is because previous buyers will be looking to exit a losing position around their entry point. This selling pressure flips the support level into a resistance level, which is where the stock has difficulty rising above.
Resistance levels are discovered when the stock’s price has risen and then “pulled back” lower. This pullback indicates that there is selling interest at these higher levels. Much like in our previous example, a resistance level can become a support level if the stock price breaks through with sufficient volume.
Moving averages
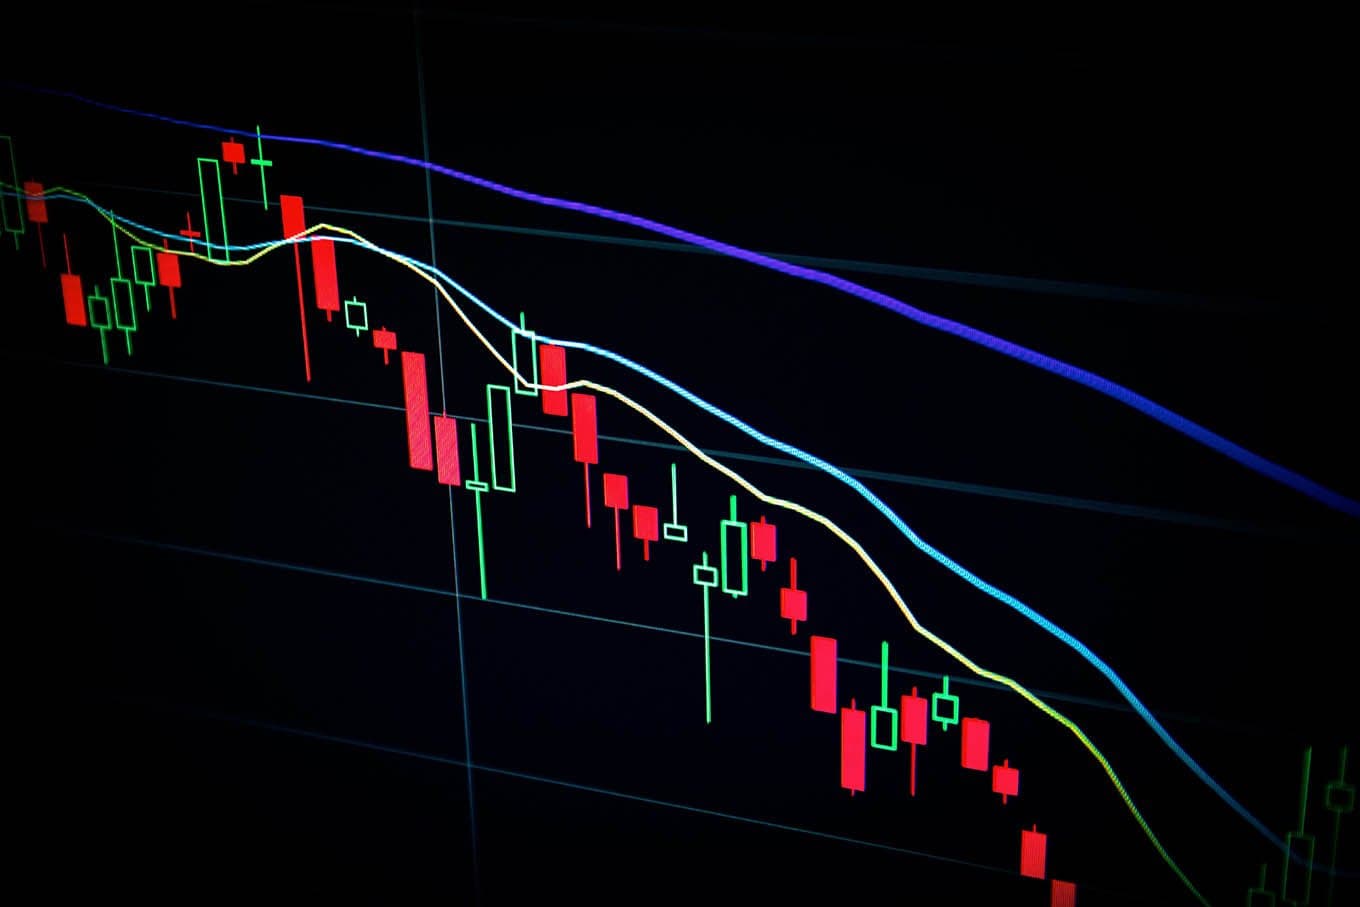
Moving averages (MA) are a type of technical indicator that smooths out data by creating a single “line” that represents the average price over a given period of time. Long-term investors may look at 20, 50, or 200-day moving averages, while short-term traders may focus on lookback periods computed using minute or hourly data. The fewer periods used, the more volatile the moving average line will be.
To generate insights, technical traders typically look at moving average “crossovers.” This occurs when a shorter-term moving average moves above or below a longer-term moving average. Generally, when a short-term MA crosses over a long-term MA, technical traders view the price action as bullish. And when the opposite is true, traders expect prices to fall.
Relative Strength Indicator
The Relative Strength Indicator (RSI) is one of the most popular momentum indicators. It measures the speed and change of recent price action to identify overbought and oversold conditions.
The RSI ranges from 0 to 100, as do other momentum indicators like the MACD (moving average convergence/divergence oscillator) and ROC (rate of change oscillator).
A reading below 30 is considered oversold, while a reading above 70 is seen as overbought. One of the most straightforward trading strategies using the RSI is to buy when the indicator hits 30 and sell—or short-sell—when it reaches 70.
Pivot points
Pivot points are technical indicators used by day traders to predict market movements and determine the prevailing sentiment. Pivot points are calculated using a simple average of three numbers: the intraday day high, the intraday low, and the previous day’s closing price.
P = (H + L + C) / 3
When the market is trading above the pivot point, future price action is expected to remain bullish. And below the pivot point, short-term sentiment is considered bearish. Technical traders use pivot points to generate buy or sell signals—or to highlight areas of potential resistance and support.
R1 (Resistance 1 ) = (P x 2) – L
R2 = P + (H – L)
S1 (Support 1) = (P x 2) – H
S2 = P – (H – L)
Fibonacci retracements
Like pivot points, Fibonacci retracements are used to pinpoint support and resistance levels. In this case, however, Fibonacci retracements are derived from the famous Fibonacci numbers.
The Fibonacci sequence starts with zero and one and is then calculated by repeatedly adding the previous two numbers in the sequence. This yields: 0, 1, 1, 2, 3, 5, 8, 13, 21, 34, 55, 89, 144, 233, 377, 610, 987, 1597, 2584, and so on.
What is mathematically interesting about the Fibonacci sequence is it produces the Golden Ratio. After the first several terms, dividing any one number by its successor yields 61.8%. Dividing one number by the number two to its right to get 38.2%. Continuing in this way, technical analysts use 23.6%, 38.2%, 61.8%, and 78.6% as key retracement levels. Oftentimes, 50% is also included as a psychological level as well, even though it does not come from the Fibonacci sequence.
These percentages indicate where a reversal is likely to occur after a rally or strong upward price movement. Technical traders use Fibonacci retracements to predict areas of future price action and to set stop-loss and take-profit orders.
Tape reading
Unlike technical analysis indicators that are based on past price action, tape reading is a form of discretionary analysis that involves trying to “read” the market’s mood. To do this, technical traders watch the level 2 window, which reveals the size of the orders being placed and the number of buyers and sellers at each price level.
The theory is that if there are more buy orders than sell orders, the price is likely to go up and vice versa. Similarly, if there is a “whale”, or a large institutional trader, placing a buy order, the price is also likely to move up as the orders are filled.
Tape reading is an advanced form of short-term trading that can help explain how prices move from minute to minute. Technical traders who use this method believe that by understanding the order flow, they can get a better sense of where the market action is headed.
Chart patterns
Perhaps the most widespread form of technical analysis is the study of chart patterns—specific price formations that tend to lead to certain market outcomes. Technical analysts believe that by identifying these patterns early, they can predict price movements and trade accordingly.
There are two types of chart patterns: continuation patterns and reversal patterns. As their names suggest, continuation patterns indicate that the current trend is likely to continue, while reversal patterns signal a potential change in direction.
Some of the most popular chart patterns include:
- Head and shoulders
- Double-top or double-bottom
- Rounding top or rounding bottom
- Cup and handle
- Pennant
- Flag
- Wedge
Many modern-day stock screeners will allow you to scan for stocks that are forming specific chart patterns. This can help save you time when you’re trying to identify potential trading opportunities.
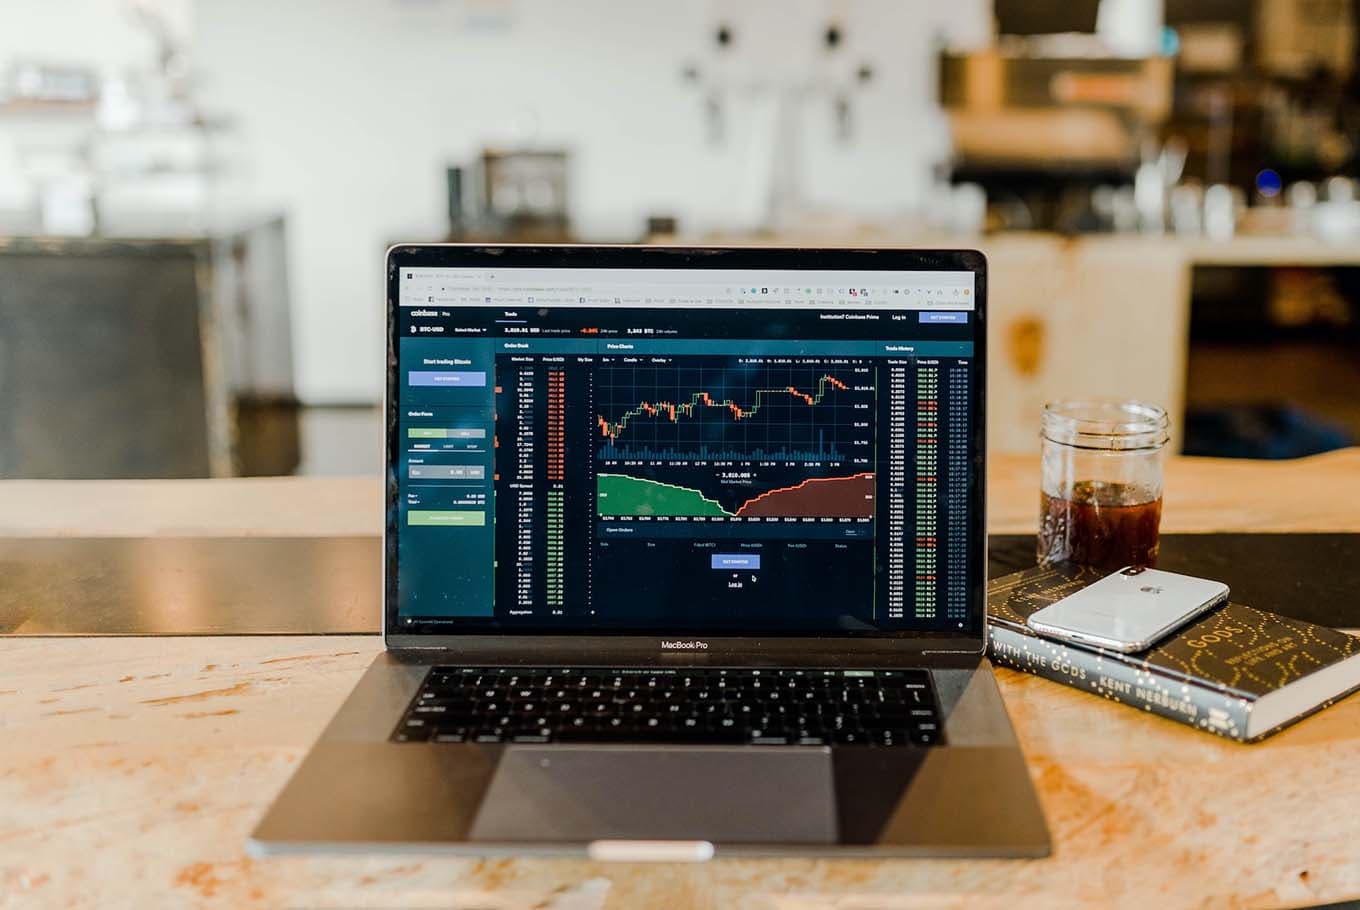
How to implement technical analysis
Now that you have a high-level understanding of popular technical analysis indicators, let’s take a look at how you can use them to execute a trade.
1) Generate signals
Using whatever combination of stock charts and indicators you choose, generate potential buy or sell signals. These signals should tell you that if a security behaves in a certain way, you will enter a trade.
2) Determine exit points
Technical analysis is not a fool-proof trading methodology. So always be sure to make an exit strategy for both good and bad outcomes. This may mean setting a stop-loss order just below a key support point or taking profits at certain Fibonacci levels.
3) Evaluate your reward-to-risk ratio
With both entry and exit points in hand, calculate your potential earnings in both a winning and losing trade. Then, assign each outcome a realistic probability. For example:
Winning outcome: $10 profit x 50% odds = $5 reward
Losing outcome: $4 loss x 50% odds = $2 risk
Reward-to-risk ratio: ($5 / $2) = 2.5x
While every stock trader is free to determine their own risk appetite, the general rule of thumb is to pursue trades with at least a 2x to 3x reward-to-risk ratio. This means that for every dollar you’re risking, your technical analysis has identified an opportunity to earn two to three dollars.
4) Pull the trigger
When you’ve found a trade that meets your criteria, enter the position. Depending on your trading activity and style, there are a variety of stock brokers that can help make the process easier.
For example, platforms like Robinhood were built for mobile-first trading. Fidelity and TD Ameritrade are great platforms for long-term investors, and Interactive Brokers and Lightspeed are popular choices for those who trade frequently or in large volume.
5) Monitor trade

While the trade is open, monitor it attentively. And when you cannot actively watch it, consider placing stop-loss and take-profit orders to protect your position.
Also, always stick to your original technical analysis plan. When a trade hits one of your exit points, close the position immediately.
Many traders fail not due to inadequate training or preparation, but because of their emotions. If a trade starts going against you, do not hold onto it in hopes of a reversal. Do not move your stop-loss order to give it more room to breathe. And most importantly, do not let greed get the best of you by holding onto a winner for too long.
Book your wins and your losses, and move on to the next trade.
6) Learn from your past
Technical analysis is not an exact science. You will make losing trades, even when following your indicators perfectly. The key is to learn from your past successes and failures and to continually refine your strategy.
The best way to do this is by keeping a trading journal, either physical or online. Each journal entry should include the trade details (entry and exit points, stop-loss and take-profit orders, etc.), your rationale for making the trade, and the outcome.
Over time, you will be able to look back at your journal and start to see patterns in your winners and losers. Use these patterns to improve your technical analysis going forward.
Final thoughts
Technical analysis is a powerful tool that everyone interested in the financial markets should master. By picking up insights from price movements and better understanding the relationship between price and volume, you can identify trends and improve your returns.
And remember, even if you are looking at long-term time frames, reading charts can help you time value investments and ride the momentum of a growth stock. Add technical analysis to your toolkit as a trader and start reaping the rewards today.
Technical analysis FAQs
How can I learn technical analysis?
To learn technical analysis, start by reading one of the many books on the subject, such as Technical Analysis for Dummies by Barbara Rockefeller or Technical Analysis Explained by Martin J. Pring. Although they are not the quickest reads, these resources will provide a helpful overview of how to analyze price movements, trends, and various candlestick charts.
Who is the father of technical analysis?
Charles Dow, one of the co-founders of Dow Jones & Company, is considered the father of technical analysis. In his early writings, he detailed various ways to analyze the markets and identify price patterns. These ideas eventually became the foundation for modern technical analysis.
What are the primary tools of a technical analyst?
Technical analysts primarily use trend lines, support and resistance levels, moving averages, and candlestick charts to identify trading opportunities. Traders on Wall Street also tend to utilize real-time market and economic data from sources like a Bloomberg Terminal to help inform their decisions.
Get more posts like this
One short, useful email each Friday. Free, no spam, unsubscribe anytime.