15 Best Valuation Metrics To Find Undervalued Stocks
From ROIC to the PEG ratio, don't invest until you understand these 15 important valuation metrics. Perfect for finding undervalued stocks!

Daniel Anderson
Editor, The Money Maniac
Updated January 11, 2024
Originally July 21, 2022 · 14 min read

Have you ever wondered how professionals find their next big stock winner? Investors like Warren Buffett rely on the power of valuation metrics.
In this guide, we pull back the curtain on 15 indispensable metrics that should be part of your stock analysis and investment decision-making strategy.
Stay tuned to learn what they are, how to apply them, and how to spot winning stock opportunities before other investors.
15 Valuation Metrics Every Stock Investor Needs To Know
Stock valuation metrics are company-specific numbers and ratios that can be used to measure, analyze, and compare different investment options.
Rather than going with your gut, these 15 metrics offer critical insights into the probability of a stock’s success so that you can spot the winners and avoid the losers.
1) Beta: Understanding Stock Volatility
Beta is the measure of a stock’s volatility.
To calculate beta, an individual stock’s returns are plotted against the returns of the market as a whole (e.g. the S&P 500). Beta is the slope of the “line of best fit” of these data points.
In other words, beta helps us predict the typical moves of a given company in relation to a 1% move from the broader stock market.
But don’t worry, you won’t need to calculate this yourself! You can find beta values on your brokerage platform, Yahoo Finance, FinViz, and other financial websites.
A beta of 1 means the stock exactly mirrors the broader market, while a beta of -1 means that the stock moves exactly opposite the market (but in the same magnitude).
A beta of between 0 and 1 means the stock moves directionally with the market but with less volatility. A beta of greater than 1 means the stock moves directionally with the market but with more volatility.
While Beta primarily measures volatility, it can indirectly highlight undervalued stocks. For instance, a stable company with a low Beta during a market downturn might be overlooked and undervalued, presenting a potential investment opportunity for value seekers.
2) P/E Ratio: The Power Of Earnings
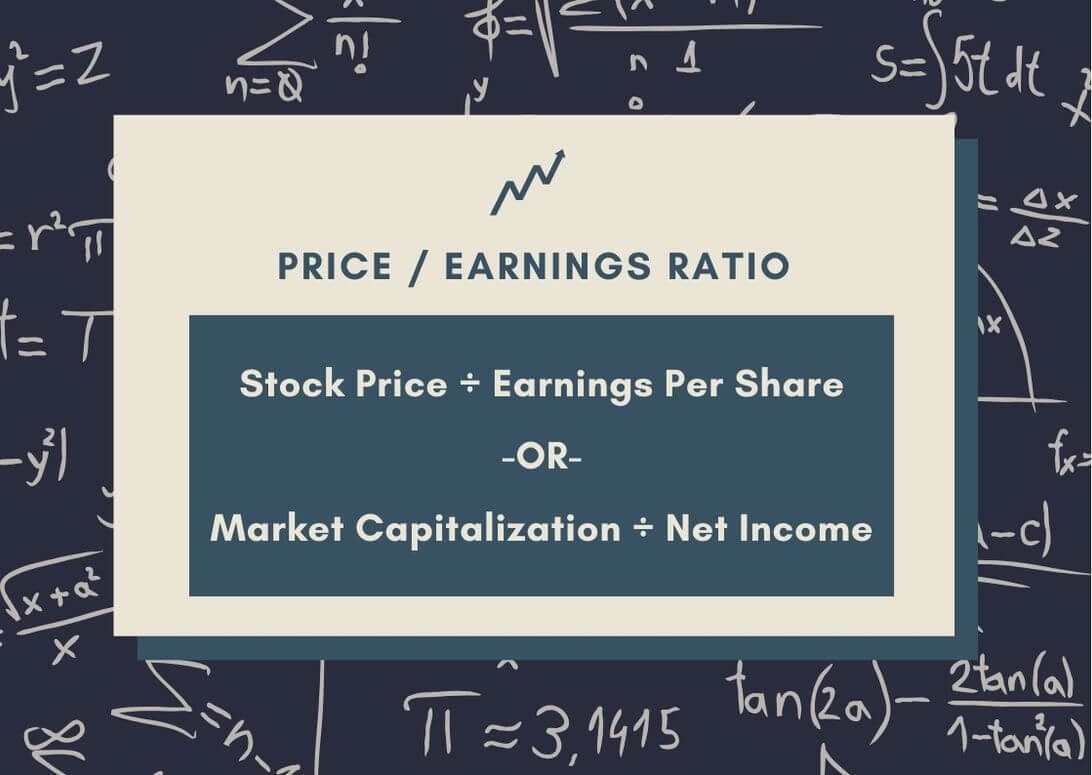
The P/E ratio, or price-to-earnings ratio, is one of the most commonly cited valuation metrics. Widely used to analyze a company’s value, it tells us how much investors are willing to pay for each dollar of a company’s earnings.
There are two ways to arrive at the P/E ratio.
The first is by dividing the company’s total market capitalization by its net income, or the last twelve months of profit. Alternatively, you can perform the calculation on a per-share basis. This means dividing the current stock price by the company’s EPS, or earnings per share.
No matter the approach, this ratio helps investors understand how expensive a stock is relative to how much profit the company generates. In general, a lower P/E ratio indicates a cheaper stock and a higher P/E ratio indicates a more expensive stock.
However, the P/E ratio does have its limitations, mainly due to the denominator.
While historical earnings are typically used in the P/E ratio, past performance does not guarantee future results. Plus, companies can manipulate their reported earnings through various accounting practices. And lastly, the ratio does not take into account growth.
3) PEG Ratio: Growth Vs. Stock Price
The PEG ratio attempts to solve this last problem with the P/E ratio. To arrive at the PEG ratio, divide the price-to-earnings ratio by an earnings-per-share growth rate.
The appropriate EPS growth rate depends on the potential duration of your investment. If you plan to buy and hold indefinitely, consider using a long-term earnings growth estimate. Whereas if you’re looking at a trade of only a few years, use a 2-3 year growth rate estimate.
Ultimately, the goal of the PEG ratio is to adjust for differences in growth prospects.
For example, Company A has a P/E ratio of 10 and an EPS growth rate of 10%, yielding a PEG ratio of 1. Company B, on the other hand, has a more expensive-looking P/E ratio of 20. However, if its EPS growth rate is 20%, Company B would also have a PEG ratio of 1.
Related reading: How To Supercharge Your Portfolio With Factor Investing
4) Earnings Yield: Another Way To Look At Earnings
The earnings yield is simply the inverse of the P/E ratio.
While the P/E ratio tells you how much investors are willing to pay for each dollar of earnings, the earnings yield tells you how much earnings you’re getting for each dollar you’re paying. To calculate the earnings yield, simply divide earnings per share by the stock price.
Of course, this valuation metric has the same limitations and provides the same insights as the P/E ratio. However, it helps compare yields across asset classes.
For example, let’s compare a stock with a P/E of 20 and a 10-year Treasury bond yielding 3%. Knowing that a P/E of 20 corresponds to an earnings yield of 5% may help you determine the relative value of these investment options.
5) Dividend Payout Ratio: Gauging Sustainability
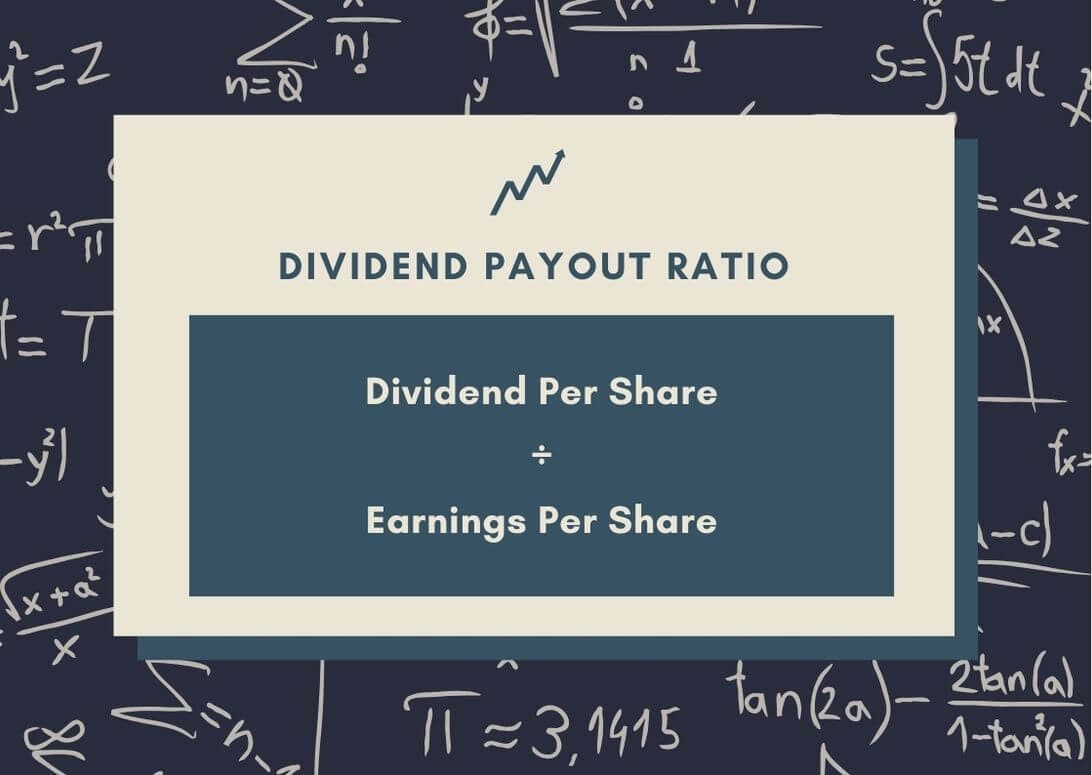
The dividend payout ratio measures the percentage of earnings paid out to shareholders in the form of dividends. To calculate this payout ratio, divide the annual dividend per share by the earnings per share.
This valuation metric is helpful for income investors to gauge the sustainability of current payouts as well as the potential for future payout increases.
For example, a company with a low dividend payout ratio has room to grow its dividend or repurchase existing shares, both of which can drive up the stock price.
On the other hand, a company with a high payout ratio, especially near or over 100%, has little room for error and may be forced to cut its dividend in the future.
If you are making an investment predicated on the stock’s dividend, this analysis is a quick way to gauge where that dividend may trend over time.
To find companies that pride themselves on their dividend stability, check out this list of Dividend Kings. These are businesses that have raised their annual dividends for at least 50 straight years.
6) Price-To-Sales: Looking Beyond Profits
Unlike many of the investment metrics discussed thus far, price-to-sales is an excellent ratio for comparing stocks that do not have positive earnings. Companies in high-growth industries like tech often delay turning a profit, but can still deliver value to shareholders via appreciation.
To calculate the price-to-sales ratio, divide a company’s market cap by its total sales over the last 12 months. For example, if a company has a market cap of $5 billion and reported $500 million in sales over the last year, its price-to-sales ratio would be 10.
To understand the relative valuation of a stock based on this metric, compare its price-to-sales ratio to businesses in the same industry or with similar growth profiles and historical averages.
7) Price-To-Book: Intrinsic Value Vs. Stock Price
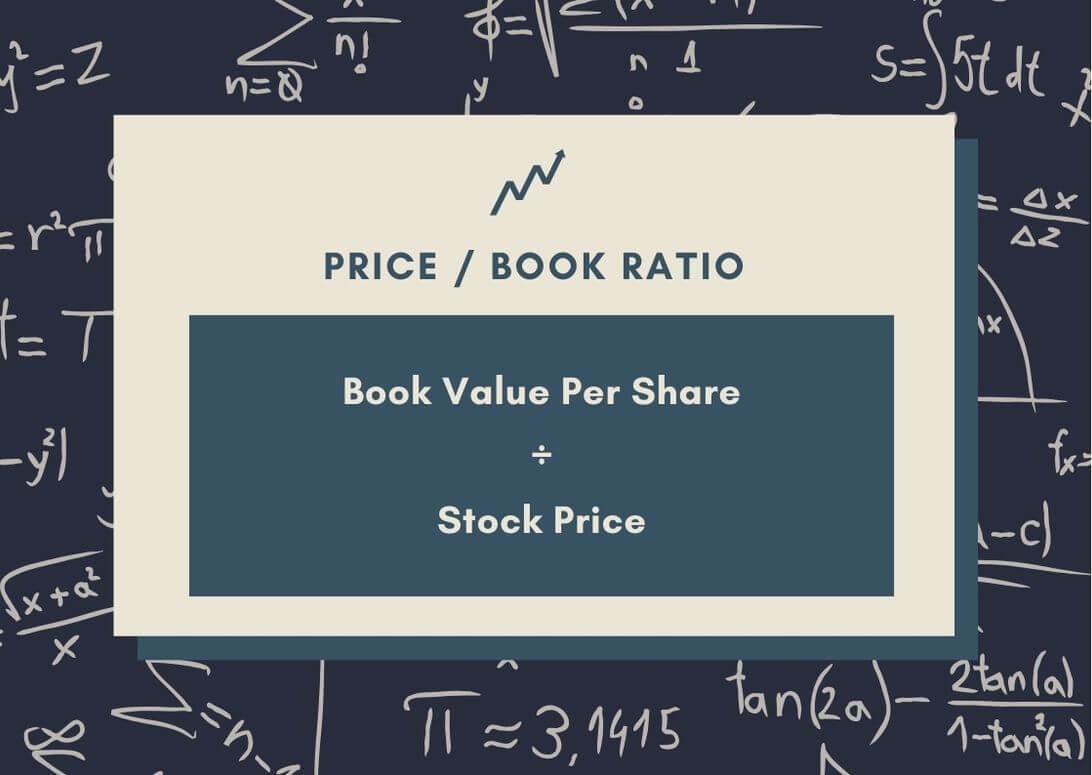
The price-to-book ratio compares a stock’s current price to its book value.
To arrive at book value, also known as shareholder’s equity, subtract a company’s total liabilities from its total assets. This difference is an estimate of the value available to equity holders if all assets were liquidated and used to repay creditors.
This valuation metric is used to compare a stock’s market price to its intrinsic value, or its value in the face of bankruptcy.
A lower price-to-book ratio indicates that a stock may be undervalued, while a higher ratio suggests it may be overvalued. A P/B ratio of less than 1 means that a company’s shares are currently trading below the value of its net assets.
8) Debt-To-Equity: The Effect Of Leverage
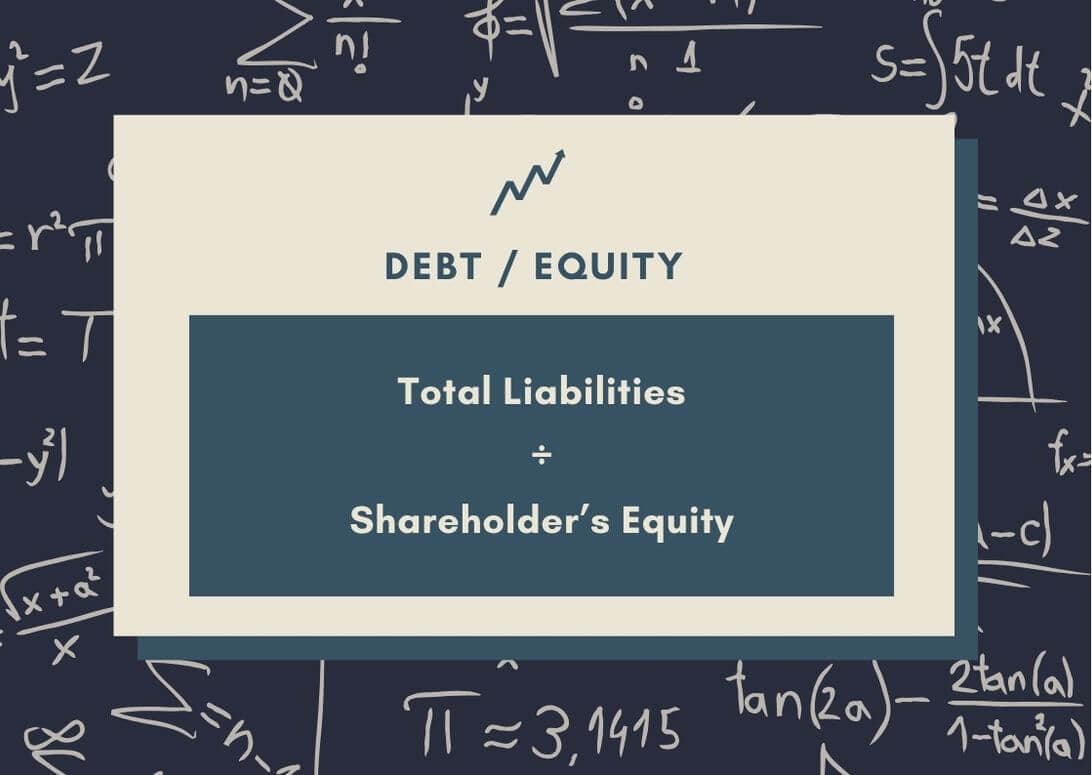
The debt-to-equity ratio highlights how a company finances its assets. Further, it indicates the company’s capacity to meet its obligations in the event of a downturn in performance.
The debt-to-equity ratio is calculated by dividing total liabilities by shareholder’s equity, two figures available on the balance sheet.
A high debt-to-equity ratio signals that shareholder’s equity is relatively low. This in turn means that the company’s assets barely cover its liabilities, which could be cause for concern. Alternatively, a low debt-to-equity ratio like 1, indicates that a company has minimal leverage.
Debt-to-equity ratios vary fairly significantly depending on the industry and the stage of the business. Capital-intensive businesses tend to be more highly leveraged with debt, as do growth-stage companies.
9) Free Cash Flow: The Power Of Liquidity
Free cash flow isn’t a ratio, but rather an alternative measure to net income.
For tax and accounting purposes, net income can be manipulated by non-cash expenses and various investments. To cut through this noise, investors often analyze free cash flow and its associated ratios.
Free cash flow can be calculated in two ways: bottom-up or top-down.
- Bottom-up approach: Take net income, add back non-cash expenses, and deduct the increase in working capital (which can be negative) and capital expenditures.
- Top-down approach: Take revenue and subtract operating costs, taxes, and required investments in operating capital.
The purpose of free cash flow is to determine how much discretionary income a business produces. In other words, after necessary investments in operations and capital expenditures, how much money is left over to repay debt, make long-term investments, or distribute capital to shareholders?
From free cash flow, a number of other ratios can be determined such as price-to-FCF, FCF yield, FCF growth, FCF-to-debt, and more.
10) Return On Equity: From A Shareholder’s Perspective
Return on equity, or ROE, is simply net income divided by the average shareholder’s equity. (Average shareholder’s equity is the average of the figure at the beginning and end of a given period.)
ROE is intended to evaluate the efficiency of a business in turning equity financing into profit. However, there are limits to the calculation.
To start, shareholder’s equity is calculated by subtracting total liabilities from total assets. This means that ROE can easily be increased by financing a business with debt instead of equity. plus, as previously discussed, net income can also be manipulated.
For these reasons, ROE is best used as a starting point for further analysis or for benchmarking companies with similar capital structures.
11) Return On Assets: Analyzing Asset Efficiency
ROE is also known as return on net assets. ROA, on the other hand, is found by dividing net income by average total assets.
This means unlike ROE, ROA factors in a company’s debt balance – yielding a calculation that takes into account all available resources.
ROA helps investors understand not just operational efficiency, but also a company’s ability to leverage its assets to generate profit. Like with ROE, it’s important to benchmark the ROA of companies within the same industry as they’re likely to share similar relative debt loads.
12) Return On Invested Capital (ROIC): Capital Productivity
ROIC, or return on invested capital, looks at a company’s efficiency in producing profit for all of its shareholders regardless of whether it uses debt or equity financing.
The numerator in ROIC is known as NOPAT, or net operating profit after taxes. This figure represents the amount of money available to pay both interest to debt holders and profit to equity holders. The denominator in ROIC equals total debt plus total equity.
ROIC is one of the most useful investment metrics because it can be compared to a firm’s WACC, or the weighted average cost of capital. The extent to which ROIC exceeds WACC tells asset managers how much value the company creates as it invests in new projects.
13) EBITDA: Uncover “True” Earning Power
EBITDA stands for earnings before interest, taxes, depreciation, and amortization.
Like free cash flow, EBITDA is intended to measure a company’s operating profit before non-operating expenses are factored in. This makes it easier to compare companies across industries because it eliminates the need to account for different capital structures, depreciation schedules, and tax rates.
EBITDA can also be used as a starting point for other valuation metrics, such as EV/EBITDA, EBITDA margin, and more. EV/EBITDA is of particular interest to investment professionals as it’s a popular valuation metric used in both private and public markets.
14) Enterprise Value: Going Beyond Market Cap

Enterprise value, or EV, represents the theoretical takeover price of a company. It’s calculated by adding up a company’s market capitalization, outstanding debt, minority interest, and preferred shares, and then deducting cash.
EV is often used as a more holistic alternative to market cap when valuing companies. This is because market cap only includes a company’s equity, while EV factors in both debt and cash. For this reason, institutional investors will often use EV/EBITDA instead of P/E to find undervalued stocks.
15) Margin Growth: Tracking Profitability Progress
As the name suggests, margin growth looks at how much a company’s margins have increased or decreased over time. This can be analyzed at various points of the income statement, including operating profit, EBITDA, and net income.
Margin growth can be calculated on a percentage basis by taking the current margin and dividing it by the margin from the same period a year ago. Or, it can be calculated on an absolute basis by taking the current margin and subtracting the margin from the previous period.
Margin growth is a helpful metric for finding companies that are becoming more efficient and profitable. It’s also useful for comparing companies within the same industry to evaluate relative performance.
Related reading: How To Learn The Art Of Top-Down Investing: 3 Key Principles
Applying Metrics To Real-World Investing
Using valuation metrics can significantly improve your stock-picking abilities. But how do you use them to get the best results?
Here are eight practical ways to improve your investment decision-making:
-
Not Stand-Alone Indicators: No single metric can give you the whole picture. While a low P/E ratio might suggest an undervalued stock, it doesn’t take into account the growth potential (PEG ratio) or its ability to weather a downturn (debt to equity ratio).
-
Combine Multiple Indicators: Use multiple valuation metrics to analyze a potential stock investment. For example, combine the PEG ratio with the payout ratio and ROIC to assess valuation, stability, and profitability.
-
Historical Trends: Instead of using metrics as a snapshot of a company’s financial health, check how they have evolved. A consistently declining price-to-sales ratio could signal a company that is struggling against the competition.
-
Compare to Peers: Compare a company’s valuation metrics to other companies within the same industry (not the overall market). To get a deeper understanding of what a “good” ROA or ROE is, for example, benchmark the target company against its direct competitors.
-
Understand the Limitations: Every metric has its shortcomings. The P/E ratio can be misleading for companies in rapid growth phases, while ROE may not be as meaningful for debt-financed companies.
-
Long-Term Perspective: Prioritize metrics that reflect a company’s long-term viability over short-term fluctuations. For instance, margin growth and EBITDA generation are likely more indicative of a sound investment than a sudden spike in stock price.
-
Sector-Specific Application: Some valuation metrics are more relevant in certain industries than others. For example, price-to-sales is better for evaluating high-growth tech startups where earnings may not yet exist. On the other hand, the P/E ratio is better suited for companies that have had years of steady earnings.
-
Manage Risk: Utilize metrics to gauge and manage investment risks. For instance, a high debt-to-equity ratio may indicate financial risk and a high beta may indicate volatility. These figures can help investors align their choices with their risk tolerance.
Final Thoughts
Incorporating these 15 valuation metrics into your stock investment strategy can give you the insight necessary to spot winning opportunities before they become mainstream knowledge.
But remember that no single metric will give you all the answers. Instead, follow the lead of investment professionals.
Use a combination of metrics to form a comprehensive picture of a company’s financial health and investment potential. Then, form a personal thesis on whether the company is worth your investment or not.
That way, whether you are analyzing that new tech start-up or reassessing a well-known blue chip, you can avoid the hype and hone in on the hidden undervalued gems.
Frequently Asked Questions
How do you measure undervalued stocks?
The most popular way to spot undervalued stocks is the P/E ratio. If a company’s P/E ratio is significantly lower than the sector average, it could indicate a potentially undervalued stock.
Another useful metric is the Price-to-Book (P/B) ratio. If less than 1, this figure indicates that the company is priced below the value of the company’s net assets.
What is the best metric for stock evaluation?
There is no one “best” metric because companies come in all different industries, capital structures, and growth profiles. Instead, use a combination of valuation metrics to get a comprehensive view of a company’s financial health.
For example, you can combine the P/E ratio with the Debt-to-Equity ratio to get a sense of the company’s relative valuation and financial stability. Then, add in the PEG ratio to see how its growth estimates compare to other investment opportunities.
What is the difference between growth vs value stocks?
Growth stocks are companies that are expected to grow at a significantly higher rate than the market. They are often found in new or rapidly expanding industries, like tech, software, and AI. Rather than paying dividends, these companies reinvested their earnings to fuel capital appreciation.
In contrast, value stocks tend to trade at a lower price relative to their fundamentals. These stocks are often considered less risky and experience less volatility than growth stocks. A classic example would be a well-established industrial company with lower growth, steady earnings, and a relatively “cheap” market valuation.
What are the basics of value investing?
Value investing focuses on identifying stocks that are priced below their “true” intrinsic value. Value investors prioritize companies with strong financial health and great long-term prospects. This often means stable earnings, low debt, and a proven track record of performance, especially during difficult economic conditions.
How does Warren Buffet find undervalued stocks?
Warren Buffet uses the Benjamin Graham method of value investing. He looks for companies with solid financials and strong management that are currently priced significantly below their intrinsic value.
Buffett prefers companies that are leaders in their industries, have a competitive advantage (often referred to as a “moat”), and show a history of stable and consistent growth. His investments are measured in decades rather than years, and he is often quoted as saying that his “favorite holding period is forever.”
Get more posts like this
One short, useful email each Friday. Free, no spam, unsubscribe anytime.