Mortgage Calculator vs Rent: A Real Cost Comparison Guide
Use a mortgage calculator vs rent comparison to weigh monthly costs, total ownership expenses, opportunity cost, and break-even timing before you decide to buy.

Daniel Anderson
Editor, The Money Maniac
October 12, 2026
13 min read

You're sitting at a kitchen table with a rent renewal in one hand and a mortgage calculator open on your laptop. The calculator says a new home would cost $2,000 a month, while your rent is $1,700. Buying looks only slightly worse, especially once someone mentions equity. Then you remember property taxes, insurance, repairs, closing costs, and the cash tied up in the down payment. Suddenly, the cheerful mortgage number looks like the first line of a bill, not the whole bill.
That's the problem with most “mortgage calculator vs rent” comparisons. They compare principal and interest with rent, then leave the expensive adults outside the room. A useful decision needs all-in housing costs, income burden, liquidity, flexibility, and the opportunity cost of your upfront cash. It also needs to treat insurance and maintenance as risks that can jump, not tidy monthly numbers that behave because a spreadsheet asked nicely.
The Rent Versus Buy Question Most Calculators Get Wrong
A young couple enters a home price, loan term, interest rate, and down payment, then compares the mortgage result with their current rent. If the figures sit close together, buying can feel inevitable. The spreadsheet has produced a number, and numbers often look objective even when half the costs never made it into the cells.
The mortgage payment is usually only principal and interest. Ownership also includes property taxes, homeowners insurance, maintenance, HOA or condominium fees, and mortgage insurance when applicable. Buyers need to budget for closing costs, the down payment, and the cost of selling if they move sooner than planned. Insurance and maintenance deserve variable inputs, because a repair bill or premium increase does not care whether your monthly model looks tidy.
Rent has fewer ownership-related surprises, but it still needs a complete ledger. Include renters insurance, utilities and tenant-paid fees, the opportunity cost of the security deposit, moving costs, and expected rent increases. Local figures matter more than a national rule of thumb.
The two ledgers that matter
| Cost category | Renting | Buying |
|---|---|---|
| Regular housing payment | Rent | Principal and interest |
| Insurance | Renters insurance | Homeowners insurance, plus mortgage insurance when applicable |
| Taxes and fees | Utilities and tenant-paid fees | Property taxes, HOA or condominium dues, utilities |
| Upkeep | Usually handled by the landlord | Maintenance and repairs |
| Cash tied up | Security deposit | Down payment and closing costs |
| Future risk | Renewal terms and rent growth | Insurance changes, repairs, taxes, and selling costs |
| Wealth effect | Invested cash can grow if the household invests it | Principal repayment builds equity, while ownership costs remain unrecoverable |
The Census Bureau's historical comparison shows why an all-in ledger matters. In 2005, median renter housing costs, including rent and utilities, were $728 per month, equal to $1,176 in 2024 dollars after inflation. By 2024, the median renter cost was $1,487, an increase of $311, or approximately 26.4%, from that inflation-adjusted benchmark. For mortgaged homeowners, the median monthly housing cost was $961 in 2005, equal to $1,552 in 2024 dollars, compared with $1,395 in 2024. The homeowner measure included mortgage payments, property taxes, utilities, insurance, and applicable condominium, mobile-home, or homeowners-association fees. (U.S. Census Bureau housing cost analysis)
The practical question: Can you afford the home's complete recurring cost, keep enough liquid cash after closing, and stay comfortable if one major expense arrives at the worst possible time?
Use the calculator to answer that question, not to admire a low headline payment. Buying pays off only when the household can carry the full cost and stay long enough for the upfront expenses to make sense. Renting is the smarter choice when flexibility, liquidity, or uncertain plans matter more than building home equity.
What an Honest Rent Versus Buy Calculator Must Include
A calculator that compares a mortgage payment with rent alone can make an expensive home look affordable. Build the buyer's ledger first, then mirror it for the renter. The Consumer Financial Protection Bureau's home affordability guidance recommends estimating property taxes and homeowners insurance separately from principal and interest, then subtracting those costs from the household's affordable monthly payment.
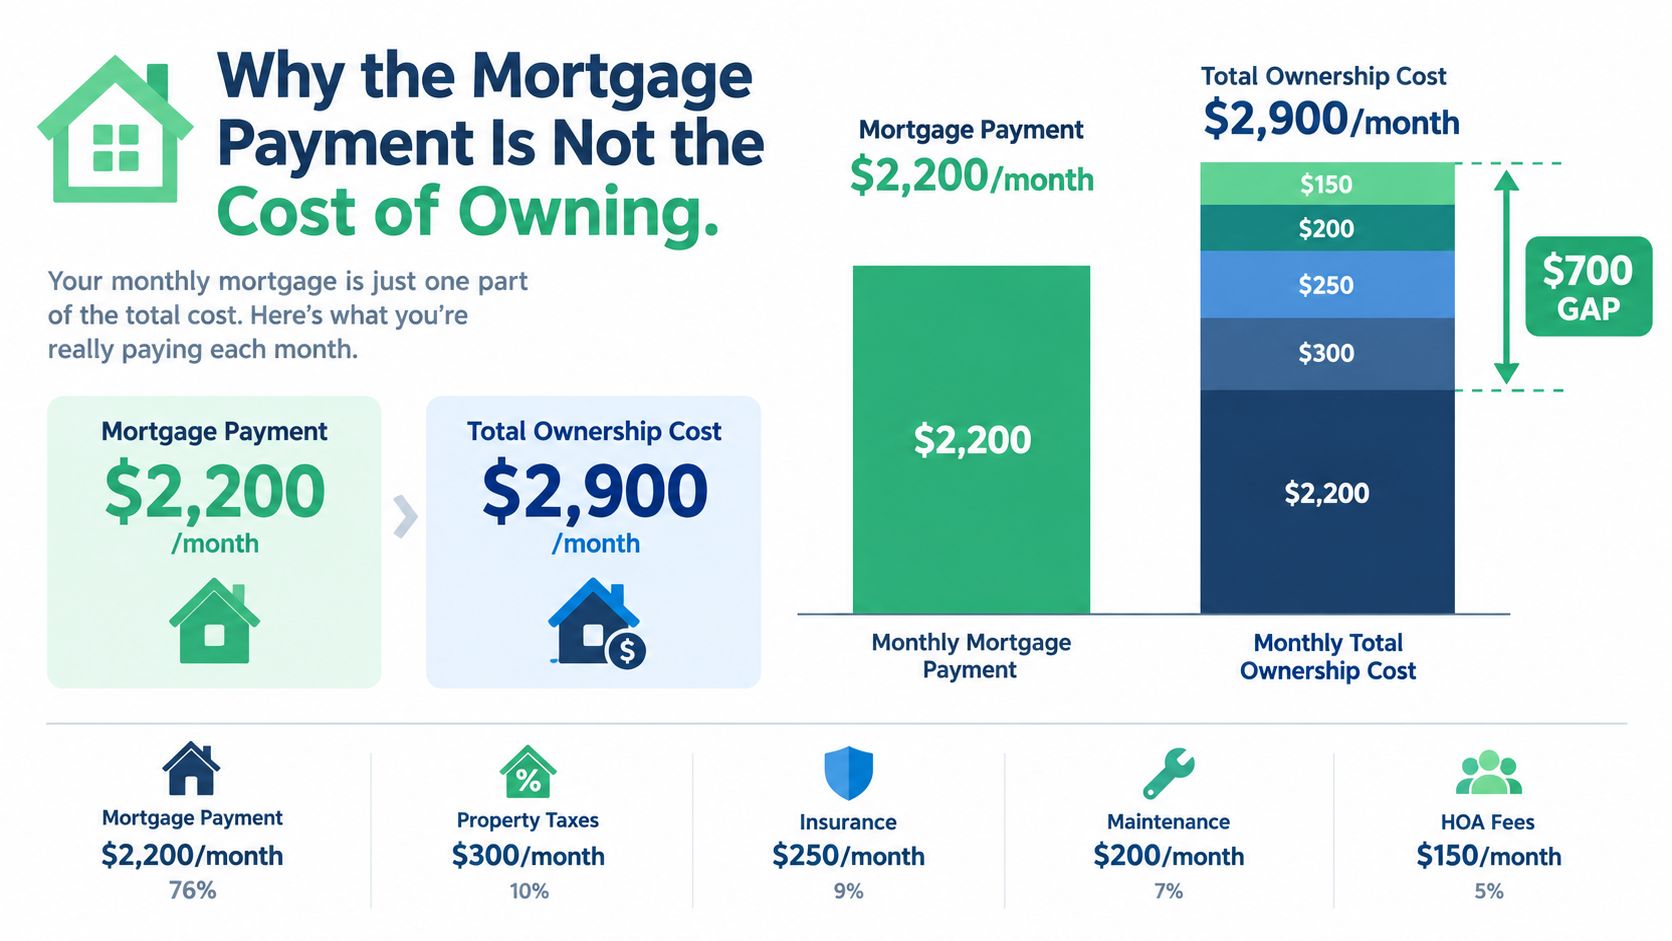
Build the ownership side
Enter each cost separately:
-
Principal and interest. Loan size, term, and interest rate set the scheduled payment. Principal builds equity. Interest pays for financing.
-
Property taxes. Use the property's assessment or a location-specific estimate. Taxes can rise even when principal and interest stay fixed.
-
Homeowners insurance. Get a quote for the property and review deductibles, exclusions, and catastrophe exposure. A broad estimate can miss the risk in a particular ZIP code.
-
Maintenance and repairs. Set a reserve and add a stress case. Older homes, aging roofs, plumbing, heating systems, and deferred maintenance call for more cash.
-
HOA or condominium dues. Include current dues and test a higher amount if the association has aging infrastructure or limited reserves.
-
Mortgage insurance. Add it whenever the loan requires it. Removing the charge because you expect to reach an equity threshold later produces an overly favorable result.
The long-term model also needs the down payment, closing costs, and expected selling costs. The down payment has an opportunity cost even though it never appears on the monthly statement. That cash could stay invested, remain available as a reserve, or fund another financial goal.
Mirror the renter's ledger
Rental costs include monthly rent, renters insurance, tenant-paid utilities and fees, the opportunity cost of the security deposit, and expected rent growth. Combine parking, service, and amenity charges with base rent so the comparison reflects the actual lease.
For a clear explanation of payment mechanics, use this guide on how to use a mortgage calculator. Buyers comparing markets across borders can also review what international buyers really pay, since purchase expenses extend beyond the advertised price.
The results should report monthly cash flow, cumulative unrecoverable costs, projected equity, and the value of cash retained by renting. Run the model under realistic and stressed assumptions for insurance, maintenance, rent growth, and investment returns. A tool that outputs only a monthly payment is not a comparison tool.
Why the Mortgage Payment Is Not the Cost of Owning
A mortgage payment can look manageable until the first tax bill, insurance renewal, or major repair arrives. Ownership costs come in two forms: predictable monthly charges, such as taxes and insurance, and irregular expenses, such as a failed heating system or roof repair. Your calculator needs room for both.
Zillow estimated that typical U.S. homeowners spent $10,946 on maintenance, $2,003 on homeowners insurance, and $3,030 on property taxes in 2025, or about $16,000 annually beyond principal and interest. (Zillow analysis of hidden homeownership costs) These figures are not a universal budget, but they show how quickly omitted costs can change the comparison.
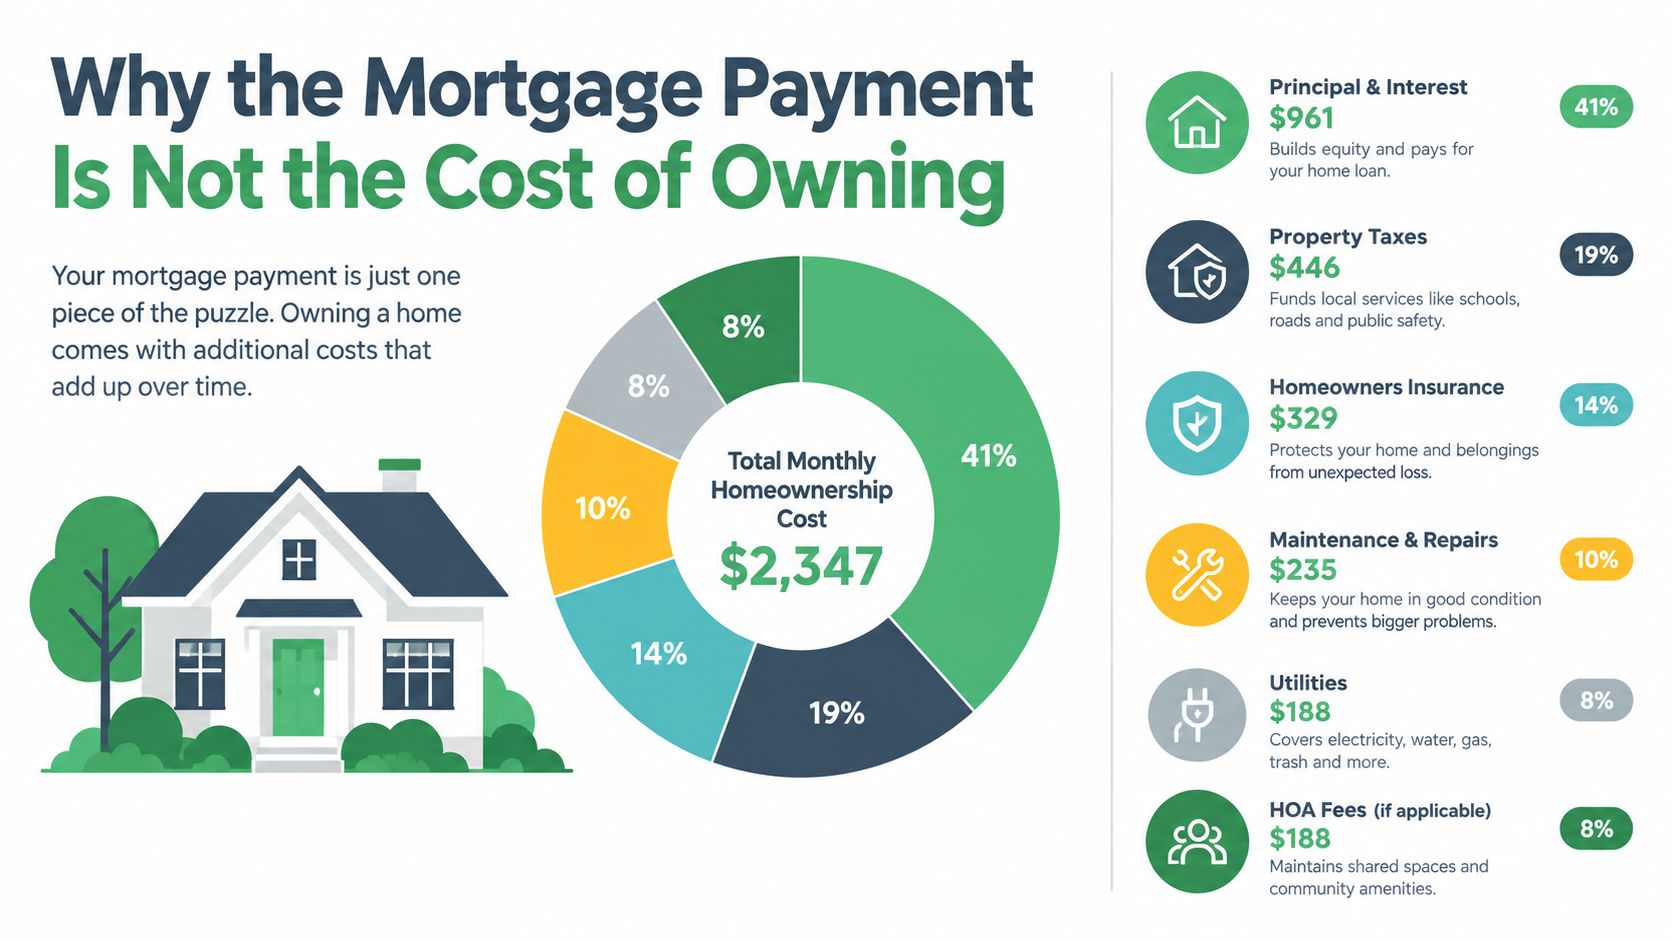
Fixed payment, variable ownership
A fixed-rate mortgage can stabilize principal and interest. It does not fix property taxes, insurance premiums, HOA dues, utilities, or repair bills. Census data cited earlier found that median monthly owner costs rose 3.8% from 2023 to 2024, while median gross rent rose 2.7%. The comparison does not predict your next renewal or repair, but it confirms that ownership costs can increase even when the mortgage payment stays steady.
Use a flat maintenance percentage as a starting reserve, not a forecast. A newer home in a well-funded association carries different near-term risks from an older detached property with an aging roof. Insurance requires the same treatment. A catastrophe-exposed location, high deductible, or difficult renewal market can change the buy-or-rent result without changing the mortgage payment.
Stress-test the uncomfortable year
Run the model with your expected insurance premium and maintenance reserve. Run it again with a materially higher insurance cost and a serious repair year. Test whether your household can absorb a $3,000 or $5,000 unexpected bill without taking expensive debt or selling long-term investments.
That test matters most when the down payment would leave little cash available. A lower principal-and-interest payment can still produce a higher total housing cost once taxes, insurance, repairs, and HOA charges enter the ledger. A beautiful amortization schedule will not pay for the roof.
Opportunity Cost and the Three Scenarios Most Tools Skip
A standard calculator often searches for one breakeven year. That's too narrow. Buying uses a down payment, while renting preserves that cash. Buying may create equity through principal repayment, while renting may leave more money available for investing, debt reduction, or a move.
Bankrate reported that renting was 38% cheaper than buying in its large-metro comparison, with buying costs rising from $2,703 in 2024 to $2,768 in 2025, while average rent was about $2,000. That doesn't settle the long-term question. It does make the monthly difference too large to ignore.

Scenario one, buy and stay long term
This scenario assumes you purchase, remain in the property for the planned holding period, pay the all-in ownership costs, and build equity through principal repayment. The model should include a conservative home-value assumption, property taxes, insurance changes, maintenance, HOA dues, the initial cash outlay, and the cost of selling at the end.
Buying has its strongest case when you can hold through the front-loaded transaction costs and keep the property long enough for principal repayment to matter. It also offers non-financial value, including control over the space and stability. Those benefits count, but they don't erase an unaffordable monthly budget.
Scenario two, rent and invest the difference
Here, the renter invests the down payment that wasn't used, plus any monthly savings after accounting for rent, insurance, utilities, and fees. Use an investment return assumption you can defend, then run a lower-return case too. The strategy only works if the household transfers the difference instead of allowing it to evaporate into food delivery and mysteriously recurring subscriptions.
A lump-sum investing framework can help you think through how the retained upfront cash enters the model. The calculator should show the investment balance alongside the buyer's projected equity, not treat home equity as the only respectable form of wealth.
Scenario three, rent temporarily and preserve mobility
Some renters aren't choosing between two permanent wealth strategies. They're buying time while a job, relationship, family plan, or location remains unsettled. This scenario values liquidity and the ability to move without selling a property.
Include likely moving costs, lease renewal risk, and the possibility that the renter will buy later under different circumstances. Renting can be rational even if buying eventually creates more nominal wealth, particularly when a purchase would make the household cash-poor or trap it in a location that no longer fits.
Monthly Cost, Total Cost, and the Income Burden Layer
A cheaper monthly payment can still be harder to afford. The Federal Reserve's 2022 household survey found that the median U.S. renter paid $1,000 in monthly rent, while the median homeowner with a mortgage paid $1,400. Yet renters paid a median 32% of family income toward rent, nearly twice the share paid by homeowners toward mortgage-related housing costs. (Federal Reserve housing findings)
The explanation is straightforward. The two groups have different incomes, and homeowners may have bought earlier under different prices or interest rates. Comparing dollar payments without comparing income is like comparing two grocery bills without checking whether one household earns twice as much.
Use a burden screen
The OECD defines housing-cost overburden as spending more than 40% of disposable income on housing costs and reports that, on average, roughly one in three low-income tenant households across OECD economies exceeds that threshold. More than one in four low-income homeowners with a mortgage are also overburdened, with rates above 40% in several countries, including the United States. (OECD affordable housing guidance)
For a simple illustration, a $1,500 monthly housing cost equals 30% of $5,000 in monthly disposable income, but 50% of $3,000. The payment hasn't changed. The household's breathing room has.
| Metric | Rent scenario | Buy scenario | Decision rule |
|---|---|---|---|
| Monthly cash cost | Rent, insurance, utilities, tenant-paid fees | Principal, interest, taxes, insurance, HOA, mortgage insurance, maintenance | Compare all-in figures |
| Housing-cost ratio | Total renter housing cost divided by disposable income | Total owner housing cost divided by disposable income | Flag results above 40% |
| Upfront cash | Deposit and moving-related cash | Down payment and closing costs | Keep sufficient liquidity after payment |
| Wealth path | Invest retained cash and monthly savings | Track principal repayment and home equity | Compare both, not equity alone |
| Flexibility | Lease terms and renewal risk | Selling and moving costs | Match the choice to likely tenure |
The monthly difference also deserves a second benchmark. Freddie Mac's September 2024 analysis estimated the mortgage payment for a typical intended purchase at approximately $600 per month higher than comparable single-family rent, or 32% higher. (Freddie Mac rent-versus-owning analysis)
Use the house-saving framework to separate the purchase fund from the emergency reserve. For readers managing rental properties or comparing lease structures, guidance on monthly rental regulations for owners can add useful context, though a personal rent-versus-buy model still needs the tenant's actual lease terms.
A Step by Step Calculator Workflow You Can Run Today
Open a spreadsheet and run the comparison in a fixed order. The aim is a defensible decision, not a mortgage payment dressed up as a verdict.
-
Set comparable housing. Use a realistic rent for a similar location, size, condition, and commute. A modest apartment beside a larger house produces a lifestyle comparison, not a housing-finance answer.
-
Enter purchase financing. Add the home price, down payment, loan amount, term, and interest rate. The Consumer Financial Protection Bureau's affordability guidance, cited earlier, treats the loan amount, term, and rate as core mortgage-calculator inputs.
-
Add recurring ownership costs. Include property taxes, homeowners insurance, HOA dues, mortgage insurance where applicable, utilities, and a maintenance reserve. Run a higher-cost case for an older property or an area with rising insurance risk. Insurance and maintenance are variable risks, not tidy fixed lines.
-
Complete the renter ledger. Enter rent, renters insurance, tenant-paid utilities and fees, deposit opportunity cost, and expected rent growth. Then invest the preserved down payment and monthly savings in the model. Leaving that money idle makes renting look worse than it may be.
-
Model tax benefits cautiously. IRS rules generally limit the mortgage-interest deduction to acquisition debt up to $750,000 for homes acquired after December 15, 2017, or $375,000 for married taxpayers filing separately. The deduction helps only taxpayers who itemize. (IRS Publication 936) Add a tax benefit only when your filing situation supports it.
-
Compare holding periods and stress cases. Review monthly cash flow, cash left after closing, cumulative unrecoverable costs, projected equity, investment balances, and the result after selling costs. Test a repair-heavy and higher-insurance case before trusting the base case.
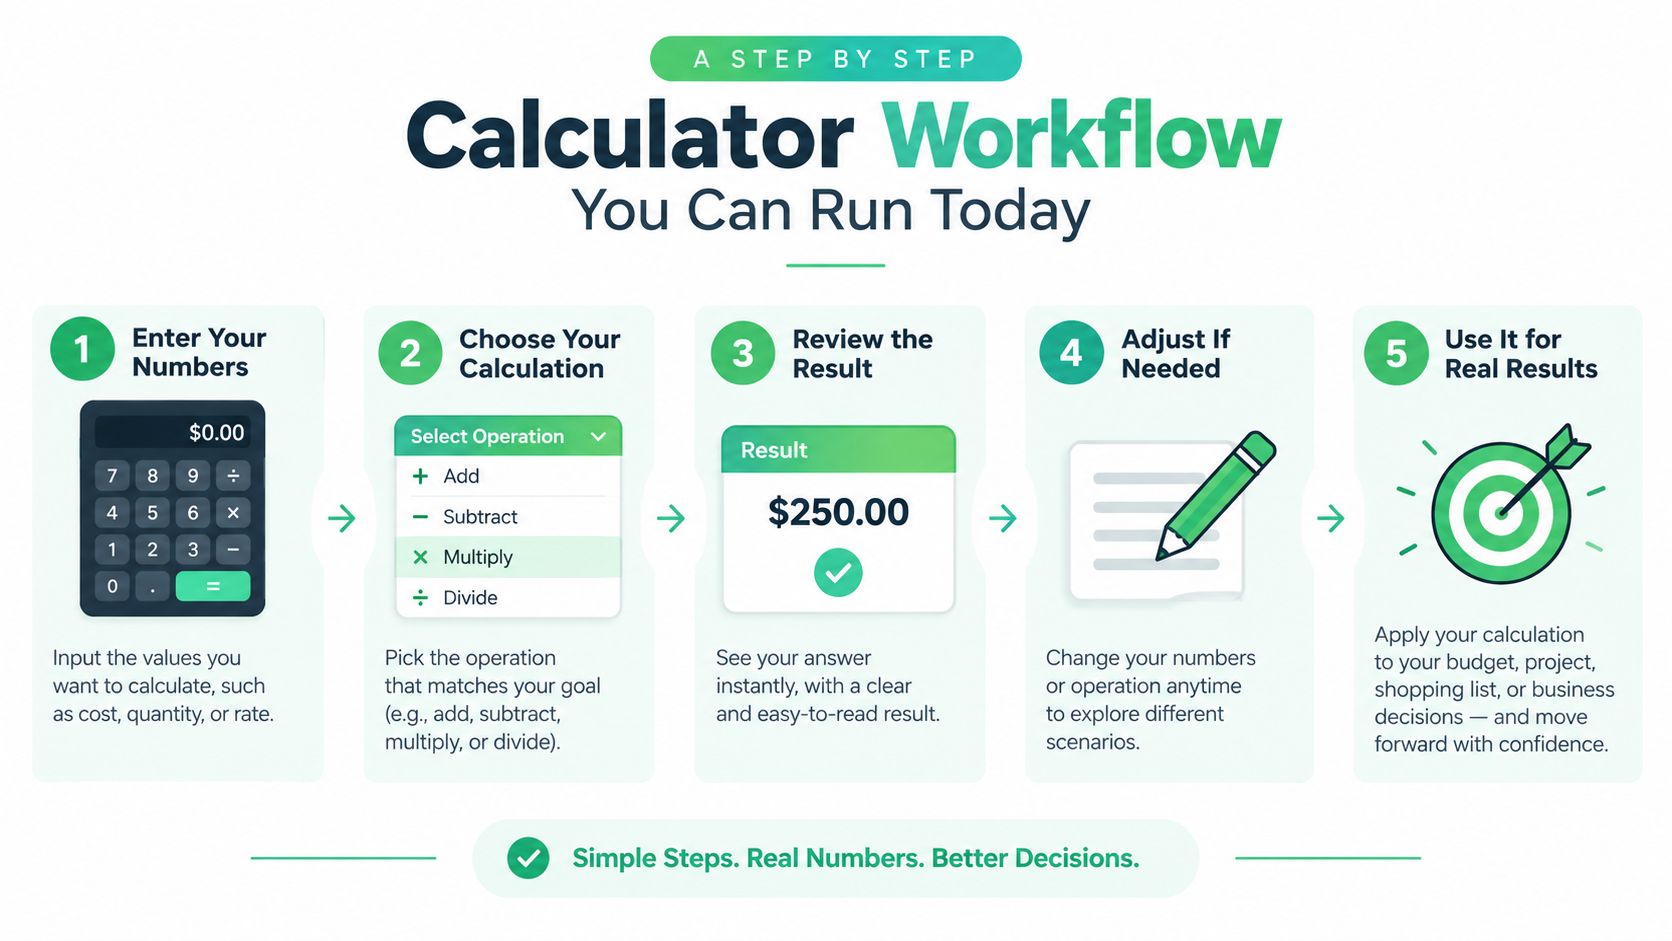
For a $350,000 home, test a 15% down payment using the actual rate available to you in 2026. Run lower-cost ownership, higher-insurance, and repair-heavy cases. The goal is not penny-perfect prophecy. It is finding the assumptions capable of breaking the decision.
Which Choice Fits Your Situation
Five situations produce five defensible answers.
You expect to relocate
Rent. A likely move makes selling costs, market timing, and illiquidity more important than the promise of future equity. Keep the down payment liquid and revisit the decision once your location is stable.
Your income is volatile
Rent until you can maintain a substantial cash reserve and a separate maintenance fund after moving in. A commission-based or entrepreneurial household shouldn't use its best income month to justify a permanent payment.
You carry substantial student debt
Rent and direct surplus cash toward the debt before stretching into ownership. A large student-loan balance can damage flexibility more reliably than a mortgage can create it. The home may be an asset, but the required monthly payments still leave your bank account.
Your local market has rising insurance risk
Demand a property-specific insurance quote before making an offer. If premiums, deductibles, taxes, and maintenance make the all-in cost fragile, rent and preserve liquidity. A lower mortgage payment doesn't protect you from an expensive renewal.
You're planning for school stability and can stay
Buying leans more attractive when the home fits the budget, the household can absorb repairs, and the planned tenure is long enough to spread upfront costs. Run the complete model and keep the purchase price below the level that forces every other financial goal into hibernation.
Renting isn't a financial failure, and homeownership isn't a moral achievement. If none of these situations fits neatly, a practical overview of alternatives to buying a house can help widen the decision beyond two emotionally loaded buttons.
The Verdict and One Calculation to Run This Week
The mortgage-versus-rent decision usually turns on three variables: how long you'll stay, what you'll do with the down payment and monthly difference, and how exposed the property is to insurance and maintenance shocks.
Buy when the all-in cost fits your income, you'll stay long enough to justify the upfront friction, and you'll still have liquid reserves after closing. Rent when flexibility matters, the ownership premium strains your budget, or the purchase would leave you one broken system away from expensive debt.
This week, choose a calculator, enter the complete rent and ownership ledgers, and run three cases: buy and stay, rent and invest, and rent temporarily. Don't speak to a listing agent or renew a lease based on the headline payment alone. Make the spreadsheet earn its keep first.
Get more posts like this
One short, useful email each Friday. Free, no spam, unsubscribe anytime.