How to Calculate Annualized Returns: Formula and Examples
Learn how to calculate annualized returns with a simple formula, worked examples, and a calculator for CAGR, irregular deposits and real returns.

Daniel Anderson
Editor, The Money Maniac
October 26, 2026
14 min read

To calculate annualized return, divide ending value by starting value, raise the result to the power of 1 divided by years, then subtract 1. For example, $10,000 growing to $16,000 over four years works out to 12.5% per year.
You might be looking at a brokerage balance that's grown nicely and wondering how much of that growth came from investing versus the money you kept adding. Or perhaps a fund advertises an impressive return that doesn't seem to match your account.
Both questions deserve an answer, but they require different calculations. Learning how to calculate annualized returns starts with compound growth, then gets more useful when you account for contribution timing, costs, and purchasing power.
How to Calculate Annualized Return Step by Step
A brokerage statement ends at $16,000. What does that balance tell you? By itself, only where the account finished. It does not reveal whether growth was quick or slow, or whether additional deposits helped it get there.
Annualized return answers the pace question by converting total growth into a constant yearly rate. For an investment without deposits or withdrawals between the start and end dates, it is also called the compound annual growth rate, or CAGR.
The formula is:
Annualized return = (Ending value ÷ Starting value)^(1 ÷ Years) − 1
The caret means “raised to the power of.” A calculator or spreadsheet can handle the exponent, but understanding what it does makes the result easier to check.
Work through the starting example
An account starts with $10,000, receives no further contributions or withdrawals, and ends at $16,000 after four years. Assume any investment income remains invested.
First, divide the ending balance by the starting balance:
$16,000 ÷ $10,000 = 1.60
That result is the growth factor. The ending balance is 1.60 times the original investment.
Next, apply the time adjustment by taking the fourth root, which is the same as raising the growth factor to the power of one-fourth:
1.60^(1 ÷ 4) ≈ 1.1247
This step asks which yearly multiplier, repeated four times, would produce a growth factor of 1.60.
Subtract one and convert the decimal to a percentage:
1.1247 − 1 = 0.1247, or about 12.5% annually
Dividing the total gain by the holding period produces a different answer: 60% ÷ 4 = 15%. That shortcut assumes each year contributed the same percentage of the original investment. Compounding does not work that way because each year's gains become part of the base that earns the next year's gains.
Follow these six steps with your own balance
The procedure stays the same for other periods. A second set of figures, $5,000 growing to $6,200 in 18 months, shows each step in action.
-
Record the starting and ending values. Use the balance on the start date, including any deposit made that day. The example starts at $5,000 and ends at $6,200.
-
Measure the holding period accurately. For a dated calculation, use elapsed days divided by 365. For this simplified example, treat 18 months as 1.5 years. Actual calendar dates can produce a slightly different fraction.
-
Calculate the growth factor. Divide $6,200 by $5,000 to get 1.24. Keep the original amounts in your spreadsheet so you do not introduce unnecessary rounding.
-
Apply the time adjustment. Calculate 1.24^(1 ÷ 1.5). The fractional exponent converts growth over the full holding period into an equivalent yearly factor.
-
Subtract one and convert to a percentage. The result is approximately 0.1538, or 15.4% annually. Use percentage formatting in a spreadsheet rather than multiplying by 100 and then applying percentage formatting again.
-
Compound backward to check. Calculate $5,000 × (1 + 0.1538)^1.5. You should arrive close to $6,200, with any small difference caused by rounding.
Check your work: Use the unrounded rate when compounding backward. A rounded display number is convenient for reading, but less useful for checking the math.
Check common gains against compounded returns
Dividing a cumulative gain by years can distort the yearly pace. In the comparisons below, the compounded column uses the annualized formula, while the simple-average column divides the total percentage change by the holding period.
Annualized return for common total gains
| Total gain | Years held | Compounded annualized return | Simple average |
|---|---|---|---|
| +10% | 1 | +10.00% | +10.00% |
| +20% | 2 | +9.54% | +10.00% |
| +50% | 3 | +14.47% | +16.67% |
| +60% | 4 | +12.47% | +15.00% |
| +100% | 5 | +14.87% | +20.00% |
| −25% | 4 | −6.94% | −6.25% |
For gains held over multiple years, the simple average overstates the compounded annual rate. For the loss example, it understates the severity of the equivalent yearly decline.
Before calculating, make sure the starting and ending figures measure total return, including investment income where appropriate. If you are combining distributions with changes in asset value, this guide to calculate ROI with income and capital gains helps clarify what belongs in the total.
For a forward-looking illustration, The Money Maniac's compound interest calculator projects how a lump sum and monthly contributions grow with compounding. The free tool requires no signup, and no data leaves the browser. Keep a projected result separate from a measured historical return.
Watch the dates and deposits closely. Do not round a fractional holding period into whole calendar years, and do not exclude a same-day opening deposit from the starting balance.
A holding period of one year annualizes to its own total return. For other periods, the formula assumes no intervening deposits or withdrawals. Once money moves in or out, the investment's pace and your personal result can be two different answers, and the ending balance alone cannot separate them.
Time-Weighted and Money-Weighted Returns Compared
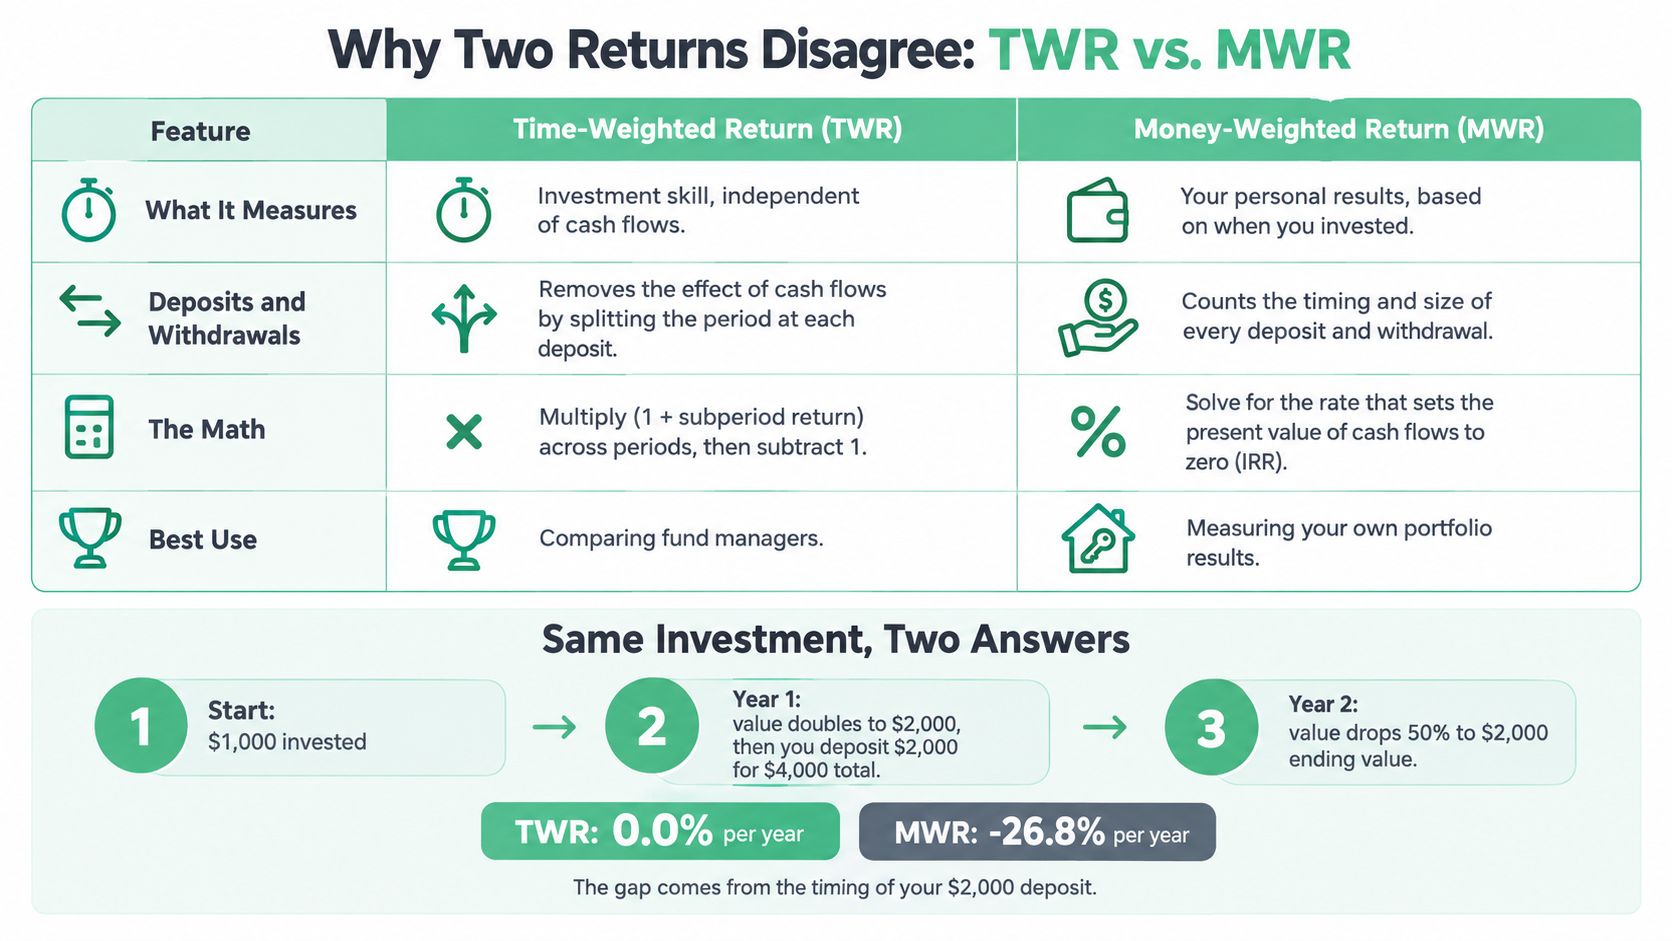
An investment that doubles one year and halves the next ends exactly where it started. An investor who adds a second deposit just before the decline still loses money. Both statements are true at once, which is how one account can accurately report a 0% annualized return and roughly a −17.7% annualized return.
Here is the sequence. A $10,000 deposit doubles to $20,000 in the first year. At the start of the second year, another $10,000 goes in, lifting the balance to $30,000. The holding then falls 50%, leaving $15,000. You contributed $20,000 and ended with $15,000, a $5,000 loss on an investment that, measured on its own, went nowhere.
Separate investment performance from your experience
The time-weighted return removes the effect of your external deposits and withdrawals. It links the yearly growth factors:
2.0 × 0.5 = 1.0
The cumulative growth factor is unchanged, so the annualized time-weighted return is 0%.
The money-weighted return accounts for how much you invested and when. Solving the cash-flow equation gives an annualized return of approximately −17.7%:
−$10,000 − $10,000 ÷ (1 + r) + $15,000 ÷ (1 + r)² = 0
Each negative term is money leaving your pocket, and the positive $15,000 is what you could withdraw at the end. The second deposit never participated in the first year's gain. It arrived in time to absorb the full decline, so more of your money sat exposed during the losing year.
Time-weighted versus money-weighted return
| Feature | Time-weighted return | Money-weighted return |
|---|---|---|
| What it measures | Performance of the fund or strategy, ignoring when you added money | Your actual experience, including when you added or pulled money |
| Math | Links subperiod returns together | Solves for the rate that balances cash flows, using IRR or XIRR |
| Affected by your deposit timing | No | Yes |
| Best for | Comparing funds, managers, and benchmarks | Judging your account and contribution habits |
| Spreadsheet approach | Multiply subperiod growth factors, then annualize | Use IRR for evenly spaced flows or XIRR for dated flows |
| Result in the worked example | 0% per year | About −17.7% per year |
The chart below runs the same comparison with a different contribution amount. The deposit sizes change; the two-measure logic does not.
What the timing gap tells you
Morningstar's 2026 research, as summarized in Midhafin's guide to benchmarking returns, reports that investors in funds with the most volatile monthly cash flows earned about 6.6% annually, versus 8.5% for investors in funds with the least volatile cash flows, a gap of roughly 1.9 percentage points per year.
That association doesn't prove every poorly timed contribution was avoidable. Paychecks, emergencies, and retirement withdrawals also determine when cash moves. Still, steady contributions and less reactive trading deserve attention before another fund search.
One caution applies when you run the math yourself: IRR can produce multiple answers or no useful answer when cash flows repeatedly change sign. XIRR handles irregular dates, but it doesn't eliminate that ambiguity. To compute a money-weighted return in a spreadsheet, enter each deposit as a negative cash flow on its actual date and the ending balance as a positive value on the final date; XIRR returns the annualized rate directly.
Pitfalls That Quietly Skew an Annualized Number
A correct formula can still answer the wrong question. The trouble usually starts with the inputs, the measurement window, or a label that leaves something important unsaid.
Mistakes in the arithmetic
Treating equal losses and gains as a recovery. In a hypothetical sequence, a 50% decline followed by a 50% gain leaves you down 25%: multiply 0.50 × 1.50 to get 0.75. The rebound applies to a smaller balance, so compound the growth factors rather than adding the percentages.
Turning a short burst into a yearly expectation. A hypothetical 8% gain over three months annualizes to approximately 36% if you calculate 1.08⁴ − 1. That's a mathematically valid equivalent rate, but it doesn't establish that the pace will continue.
For short holdings, emphasize the actual holding-period return and label it not annualized. If you also show an annualized equivalent, make its limited meaning unmistakable.
An annualized equivalent describes a rate. It doesn't supply evidence that you can earn it again.
Mistakes in the comparison
Use this checklist before accepting a return figure:
- Cherry-picked endpoints. Starting near a market bottom can make performance look unusually flattering. Compare investments over identical windows, such as three, five, and ten years, and inspect more than a single favorable interval.
- Gross returns presented as take-home results. Check whether the quoted performance includes investment expenses, account charges, and taxes. Don't subtract a fee again if the published figure already includes it.
- Unlike periods placed side by side. A five-year annualized return and a one-year return describe different market experiences. Match the start date, end date, and treatment of distributions before ranking them.
- Price appreciation mistaken for total return. Check whether dividends or other distributions are included. Otherwise, you may be comparing an income-producing investment with a price-only chart.
A smooth annualized figure also conceals the path your balance took. It won't tell you how deep the temporary losses were or whether you could have stayed invested through them.
If a number looks unusually strong, recompute it from the starting and ending values before repeating it. Then check the cash flows and the fine print. A calculator can verify arithmetic; it can't repair a misleading comparison.
Real Returns After Inflation, Fees and Taxes
Your nominal return measures growth in dollars. Your real return measures growth in purchasing power, after accounting for inflation.
A larger account balance can buy less than you expected if prices also rose. That distinction matters when your goal is paying future rent, groceries, or retirement expenses.

Apply costs and inflation without double-counting
Start with performance after recurring investment costs. Then convert the nominal growth factor into a real growth factor:
Real return = (1 + Nominal return) ÷ (1 + Inflation rate) − 1
Consider a hypothetical 8% nominal return with 3% inflation:
1.08 ÷ 1.03 − 1 ≈ 4.85% real return
Subtracting inflation gives 5%, which is a useful rough estimate but not the exact result.
Now assume the quoted return is before a 0.5% annual expense ratio. Using a simplified subtraction, the after-fee nominal return becomes approximately 7.5%, and the inflation-adjusted return becomes approximately 4.4%.
- Check the starting figure. If performance is already net of fund expenses, don't subtract those expenses again.
- Match the periods. Use inflation for the same measurement window as the investment return.
- Track taxes separately. Calculate the account's actual tax consequences before converting the after-tax nominal result into purchasing power.
Taxes and currency need their own assumptions
In a taxable brokerage account, dividends and realized gains can create tax obligations. A traditional IRA generally defers income tax until distributions, with treatment depending on contribution history and applicable rules.
Don't apply one blanket tax haircut to every account. Identify taxable distributions, realized gains, and the account's tax treatment first. If Australian dividend income is relevant to your situation, Everglow Prosperity's guide to checking your dividend franking credits addresses a separate issue that shouldn't be treated as a general U.S. tax rule.
Currency can change the result, too. The UBS Global Investment Returns Yearbook 2025 tracks stocks, bonds, bills, inflation, and currencies across 35 markets, reinforcing the importance of evaluating foreign holdings in the currency you'll eventually spend.
For this hypothetical example, report the results side by side: nominal, 8% before expenses; after-fee nominal, approximately 7.5%; after-tax, requiring your actual tax calculation; real after fees, approximately 4.4% before taxes, assuming 3% inflation. Those labels are more informative than one attractive percentage.
Annualized Return Worksheet and Calculator
Start with the balances and dates you can confirm. For an investment with one opening amount and no later external cash flows, the worksheet calculates the annual growth rate from the starting and ending values. Keep full precision in the calculation, even if you round the displayed result.
Fill in the inputs
Annualized return worksheet
| Input or output | What to enter | Example |
|---|---|---|
| Starting value | Balance on the start date, including any deposit made that day | $10,000 |
| Ending value | Balance on the end date, before taxes owed on a sale | $16,000 |
| Years held | Elapsed days divided by 365, or the stated duration for a simplified example | 4.0 years |
| Growth factor | Ending value divided by starting value | 1.60 |
| Annualized return, no cash flows | Growth factor raised to 1 divided by years, minus 1 | About 12.5% |
| Irregular deposits or withdrawals | Record each external cash movement and the final balance on its date | Use the actual dated cash-flow schedule |
The worksheet doesn't separately adjust for taxes, fees, or inflation. Costs already deducted from your account balance are reflected in that balance. Take care with any additional adjustment so you don't count a cost twice.
Enter the spreadsheet formulas
Put your starting value in B1, ending value in B2, and years held in B3. Enter:
=(B2/B1)^(1/B3)-1
Format the result as a percentage. To display the growth factor separately, enter:
=B2/B1
Use the return method described in the earlier comparison when the account has external cash flows. In a separate sheet, put dates in column A and cash flows in column B. Record contributions as negative amounts, withdrawals as positive amounts, and the final account value as a positive amount on the valuation date.
For a schedule occupying five rows, use:
=XIRR(B1:B5,A1:A5)
Replace those ranges with your actual rows. Check the spreadsheet's output against the cash-flow schedule before relying on it.
Before trusting the output: Confirm that every external cash movement appears once and that your final balance uses the same ending date as your calculation.
If the answer looks wildly off, check these details:
- Dates are valid and ordered. Use actual date cells and put the initial investment first.
- Cash-flow signs are consistent. The opening investment should be negative, with at least one positive value elsewhere.
- The ending valuation is current. Include the final account balance even if you haven't sold the investments.
- Internal activity stays internal. Don't record a reinvested dividend or an investment purchase inside the account as a new external contribution.
For planning, use an S&P 500 growth scenario to test assumptions about contributions and future growth. Keep assumed returns in a separate projection so this worksheet stays focused on historical results.
Choosing the Right Annualized Number for Your Decision
Three decisions, three different numbers. Picking a fund, judging your own timing, and sizing a retirement plan each call for a different view of the same performance history.
The fund decision. When comparing funds or managers, the published time-weighted return is the relevant figure because it strips out the effect of when money arrived. Pull matching five- to ten-year periods, net of investment expenses, from the fact sheet or prospectus, and check the benchmark, risk level, and treatment of distributions before ranking options.
The account decision. When judging your own results, the money-weighted rate is the relevant one because it reflects when your deposits really landed. The two figures can diverge sharply: a fund can post a 0% annualized time-weighted return across a period while an investor who committed most of the money just before a drop sits near -17.7% annualized. Both numbers are honest. They measure different things, and the gap between them carries the useful information.
Use the gap to investigate the cause
If your money-weighted return trails the fund's time-weighted return by more than a couple of percentage points, treat the gap as a prompt to investigate. Its size alone won't tell you who or what is at fault.
Ask practical questions:
- Were contributions reactive? Check whether you increased purchases after strong performance or sold after declines.
- Did life determine the timing? A necessary withdrawal or delayed paycheck isn't the same as an avoidable trading decision.
- Were you comparing like with like? Match the dates, holdings, and account-level charges before drawing conclusions.
When deciding how to invest money already available, weigh your cash needs and risk tolerance alongside the principles of lump-sum investing. Hindsight makes past entry points look obvious; it reveals nothing reliable about the next one.
Keep historical results separate from planning assumptions
Retirement and other spending goals run on a different number again: an after-cost, inflation-adjusted assumption that reflects the account's tax treatment. Build the plan on less favorable outcomes than recent history delivered, so a stretch of weak markets leaves it intact.
The distinction between expected and guaranteed performance matters here. Artul.ai explains investment return uncertainty, a useful reminder when translating a historical calculation into a future assumption.
This week, pull three years of statements, list every deposit and withdrawal with its date, and run the worksheet. You'll have a concrete starting point for deciding whether to change your investment, your contribution habits, or the number you've been watching.
Get more posts like this
One short, useful email each Friday. Free, no spam, unsubscribe anytime.