S&P 500 Return Calculator
Learn how an S&P 500 return calculator works, including the inputs, assumptions, and outputs that matter, plus real examples.

Daniel Anderson
Editor, The Money Maniac
September 24, 2026
14 min read
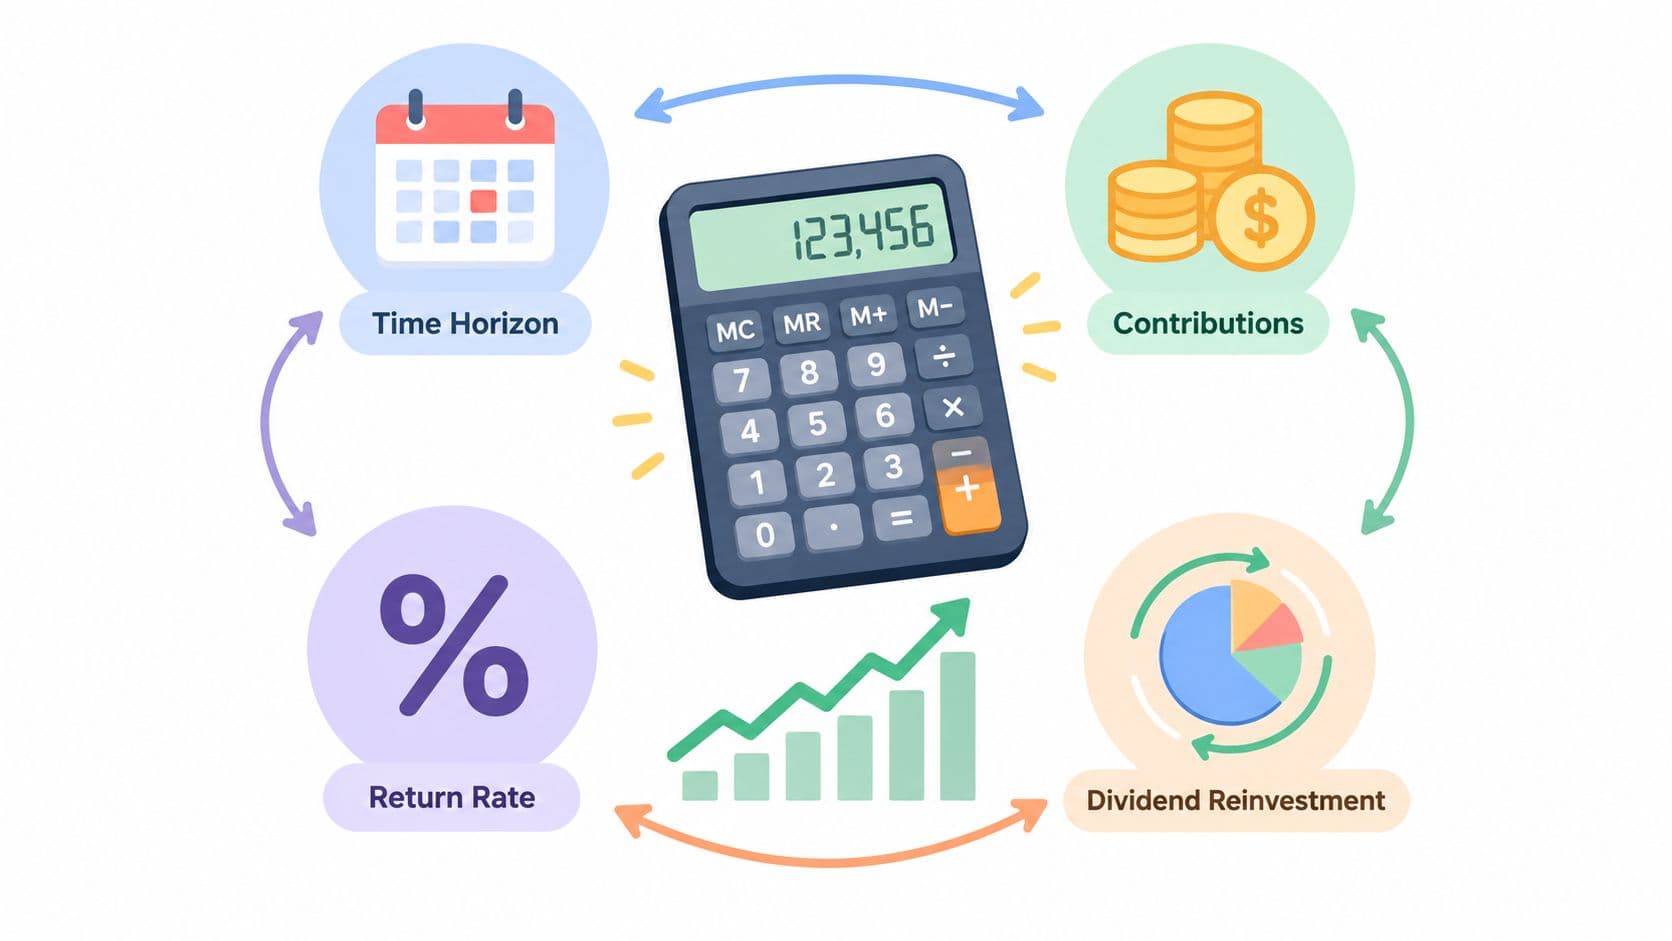
You're looking at a retirement contribution and wondering what it might become. Perhaps the question is whether investing $500 a month for 25 years could support a comfortable retirement. An S&P 500 return calculator can turn that question into a structured estimate, but it can't tell you what the market will deliver.
The useful output is less a prediction than a way to compare assumptions. Change the return rate, contribution schedule, inflation, taxes, or fees, and you can see which decisions matter most. The calculator becomes much more valuable when you understand what it's doing behind the screen.
What an S&P 500 Return Calculator Actually Does
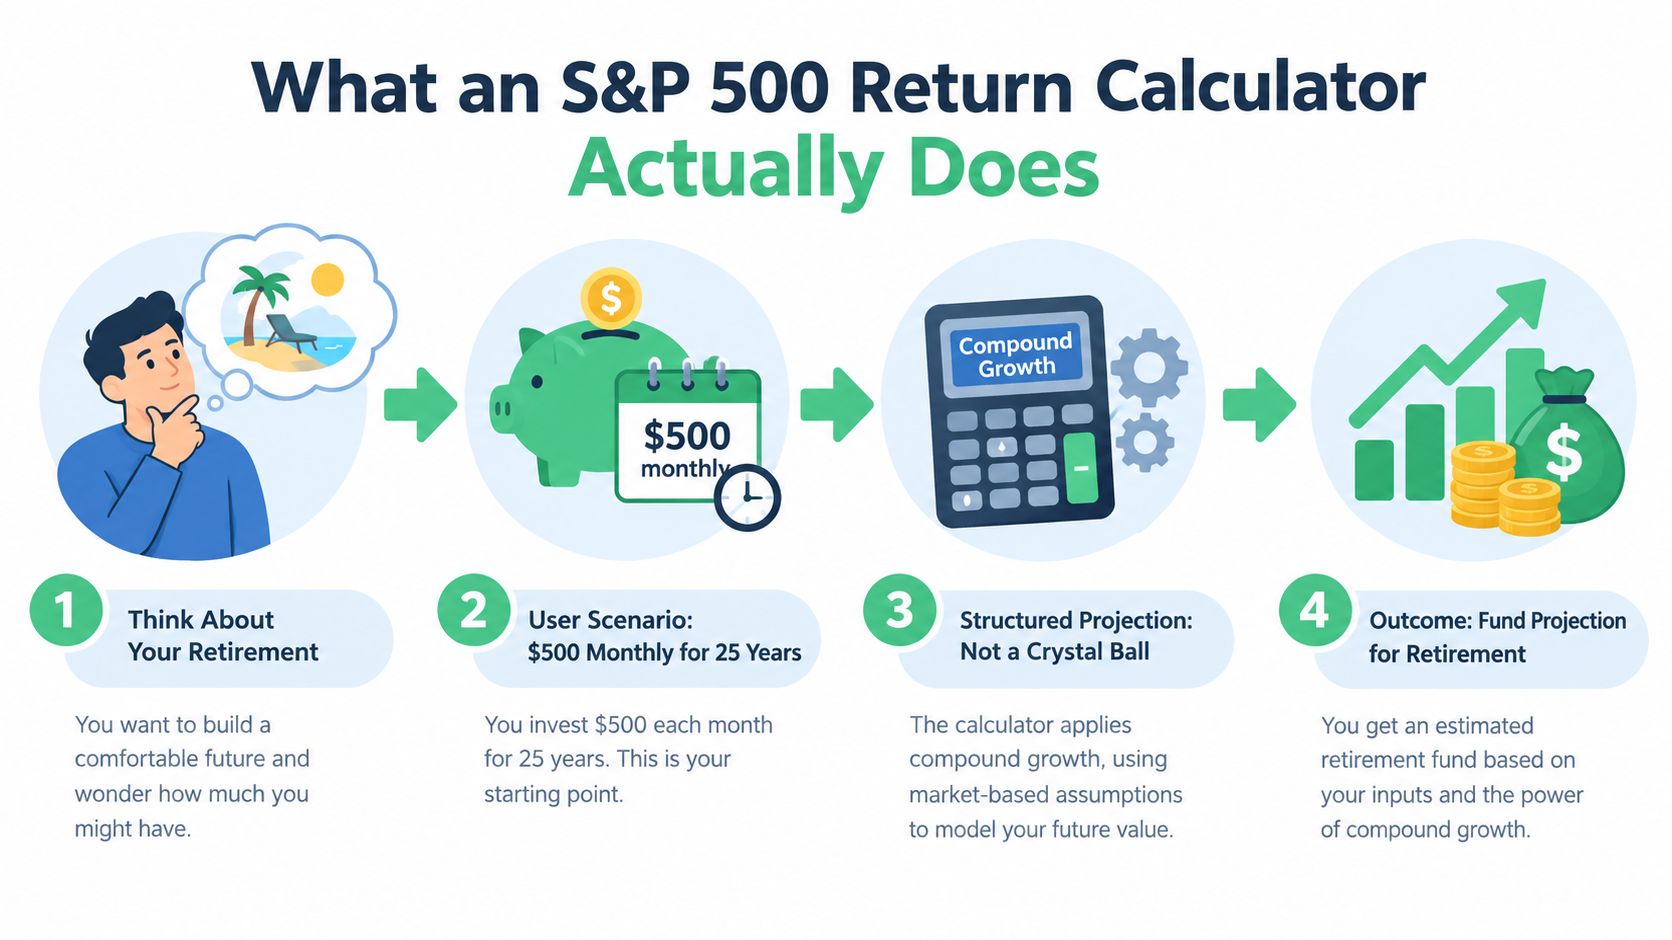
An S&P 500 return calculator takes a set of inputs and applies compound-growth math across a chosen period. It usually performs four jobs:
- It translates your starting balance and contributions into an investment schedule.
- It applies an assumed annual return.
- It repeats that growth across monthly, quarterly, or annual compounding periods.
- It separates the result into your contributions, investment growth, and ending balance.
That sounds straightforward because it is. The tricky part is deciding which assumptions deserve to go into the fields.
The calculator also treats the S&P 500 as a single return assumption. It doesn't simulate the individual companies inside the index, the exact order of market gains and losses, or the trading experience of a particular fund. A total-return setting generally assumes that dividends are reinvested, while a price-return setting tracks only index-price changes. S&P Dow Jones Indices explains how total-return indexes incorporate reinvested dividend income.
The four moving parts
Suppose you enter a starting balance, a recurring contribution, an expected return, and a time horizon. The tool doesn't know whether you'll maintain those deposits or whether the market will produce anything close to the selected return. It applies the same rule consistently so you can inspect the consequences.
That makes it a projection engine, not a crystal ball. Its output is only as credible as the assumptions behind it.
| Calculator job | What it means for you |
|---|---|
| Build the cash-flow pattern | Shows when money enters the account |
| Apply a return assumption | Estimates how the balance grows |
| Compound each period | Allows earlier money to grow for longer |
| Split the result | Separates contributions from investment growth |
For broader comparisons, a tool that helps you forecast investment returns can provide another way to examine how different rates and contribution patterns affect a long-term outcome. Use any projection alongside your own assumptions, not as a guarantee.
Inputs You Should Be Able to Set
A serious calculator should expose enough controls to show how the estimate changes. If a tool hides its defaults, you're forced to trust assumptions you can't inspect.
Start with the cash flow
Your starting balance tells the calculator how much is invested immediately. A dollar invested at the beginning of the period has more time to compound than a dollar deposited near the end.
The contribution amount and frequency matter just as much. Monthly contributions and annual contributions aren't interchangeable, even when their yearly totals match. Monthly deposits enter the market throughout the year, while an annual deposit may be modeled at the beginning or end of the period.
The time horizon can be entered as a number of years or as a specific end date. A date-based calculation is useful when you're planning around retirement, a home purchase, or another fixed deadline. Short periods can make the result highly sensitive to the starting point.
Then inspect the return assumptions
The expected annual return is the engine's central assumption. A fixed rate produces a smooth projection, while a trailing historical return describes what happened during a particular window. Those are different questions. The S&P 500 produced a 9.92% nominal CAGR from 1928 to 2025 and a 6.64% inflation-adjusted CAGR over that span, while its trailing ten-year annualized total return was 13.44% for the period ending September 16, 2026. The historical return calculations and period definitions are presented here.
Compounding frequency determines how often the calculator applies growth. Monthly compounding is common for monthly deposits, but the most important issue is whether the tool clearly explains how it converts the annual assumption into periodic growth.
Add realism where the tool allows it
A useful calculator should also let you control:
- Dividend reinvestment, which determines whether distributions buy additional exposure.
- Inflation, which converts a future nominal balance into estimated purchasing power.
- Annual fees, including fund expenses or advisory charges.
- Taxes, applied according to the account type and the model's chosen treatment.
| Input | What It Controls | Typical Default | Effect on Output |
|---|---|---|---|
| Starting balance | Money invested immediately | Often zero | Raises the base that compounds |
| Contribution amount | New money added | User-entered | Increases both deposits and future growth |
| Contribution frequency | Timing of deposits | Monthly | Changes how long each deposit compounds |
| Expected return | Annual growth assumption | Tool-specific | Usually has the largest long-term effect |
| Time horizon | Length of investment period | User-entered | Gives compounding more or less time |
| Compounding frequency | How often growth is applied | Monthly or annual | Slightly changes the projection |
| Dividend reinvestment | Treatment of distributions | Often on | Raises modeled total return |
| Inflation rate | Purchasing-power adjustment | Tool-specific | Lowers the real ending value |
| Annual fee | Ongoing investment drag | Often zero | Reduces net compounding |
| Tax rate | Tax impact in the model | Often zero | Lowers after-tax wealth |
Defaults vary widely. Two calculators can accept identical visible inputs and still produce different balances because one includes dividends, inflation, fees, or contribution timing while the other doesn't.
Return Types the Calculator Should Distinguish
A calculator can show a polished ending balance while answering the wrong question. Before reading the result, identify whether the calculation uses nominal or inflation-adjusted dollars, price return or total return, and whether dividends are reinvested.
Nominal return measures investment growth before inflation. It is useful for comparing the account balance shown by a projection with a future statement, but it does not show how much that balance may buy.
Real return adjusts the result for inflation. If a calculator projects a large future balance, its inflation-adjusted output estimates that balance's purchasing power in the starting period. Historical comparisons show why the distinction matters: the S&P 500's nominal CAGR was 9.92% from 1928 to 2025, while its 6.64% real CAGR was lower. The long-term S&P 500 return comparison is documented in the historical data summary.
Price and total return answer a second, separate question. Price return tracks changes in the index level alone. Total return includes dividends and assumes they are reinvested. The index methodology describes total return as price movement plus reinvested dividend income, so a price-only calculation can understate a long-term investor's modeled outcome. The index methodology explains the distinction between price and total return.
| Return Type | What It Includes | Typical Long-Term Value | Best Used For |
|---|---|---|---|
| Nominal | Growth before inflation | Historical averages vary by period | Comparing raw account projections |
| Real | Growth after inflation | Long-run real results vary by period | Retirement purchasing power |
| Price | Index-price movement only | Lower than total return when dividends are excluded | Studying index levels |
| Total | Price movement plus reinvested dividends | The more complete investor measure | Long-term portfolio modeling |
Match the definition to the decision
For a brokerage-balance comparison, nominal dollars may be the clearest view. For a retirement question, real dollars are usually more informative because expenses will also rise over time. A calculator should label both outputs when possible, rather than leaving you to infer the distinction.
The S&P 500's modern structure dates to 1957, while historical return series extend back to 1928. That longer record supports calculations across different market periods, though it cannot predict which return path will occur next. An overview of the index's history and long-run return measures appears in this S&P 500 average-return explanation.
Before accepting an output, ask: Which return definition did the calculator use, and which definition fits my decision? A mathematically correct number can still mislead if it measures price growth when you need dividend-inclusive results, or nominal dollars when you need purchasing power. A guide to investment metrics can help clarify related measures such as CAGR and inflation-adjusted return.
The Math Behind the Numbers
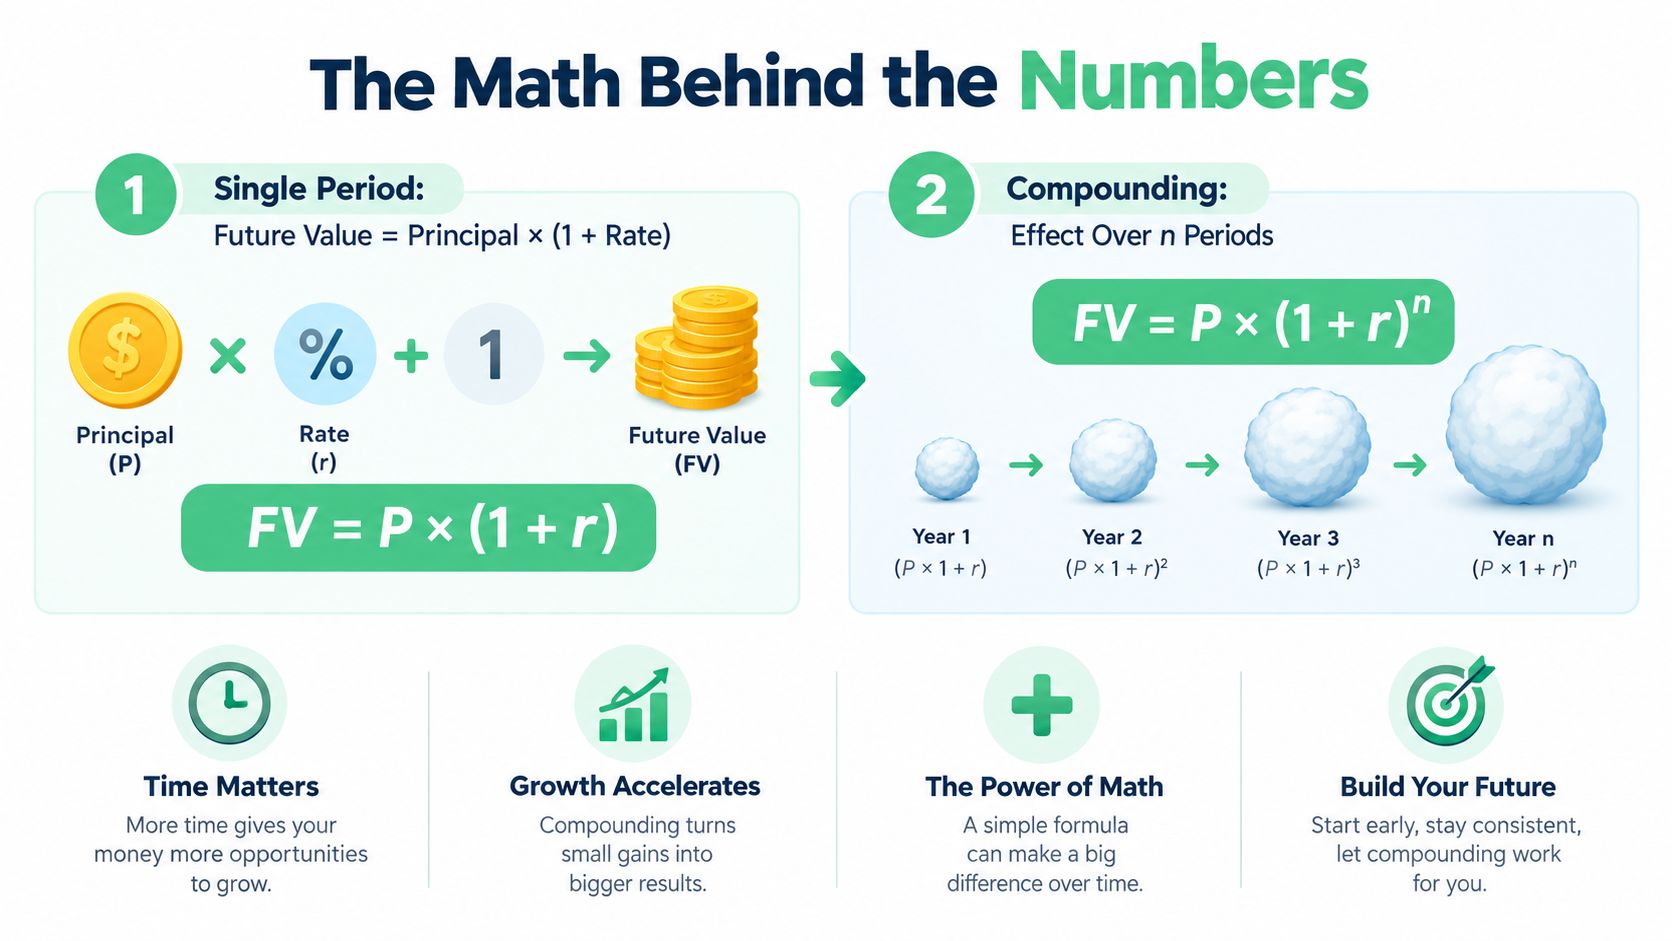
The basic compound-growth formula is:
FV = P × (1 + r)
Here, P is the principal, or starting amount, r is the return for one period, and FV is the future value after that period.
For multiple periods, the formula becomes:
FV = P × (1 + r)^n
The exponent matters. Growth gets applied not only to the original money, but also to previous growth. That's why time and return interact multiplicatively instead of adding together.
Contributions create many small investments
With recurring deposits, the calculator treats each contribution as its own mini-lump-sum. The first monthly deposit grows for the longest period, while the final deposit has almost no time to compound. The tool grows each deposit from its contribution date to the end, then adds the results together.
For a simplified annual rate of 7%, dividing by twelve gives approximately 0.583% per month. A more exact conversion may use the twelfth root of the annual growth factor, so the displayed result can differ slightly depending on methodology.
The difference between monthly and annual compounding usually matters less than the return assumption, contribution amount, and time horizon. Still, a transparent calculator should disclose the choice.
Practical rule: Treat the formula as an explanation of the estimate, not evidence that the market will follow a smooth line.
A year-by-year schedule makes the process easier to audit. It shows deposits, growth, and ending balances in sequence, which is more informative than a single large number. For a dedicated explanation of the same mechanics, review this compound interest calculator guide.
Worked Example With a $10,000 Lump Sum
Consider a straightforward scenario: $10,000 invested at the start, no additional contributions, a 30-year horizon, and an assumed 7% annual total return. This example assumes dividends are reinvested and taxes are excluded.
| Year | Ending Balance | Cumulative Growth |
|---|---|---|
| 5 | $14,026 | $4,026 |
| 10 | $19,672 | $9,672 |
| 20 | $38,697 | $28,697 |
| 30 | $76,123 | $66,123 |
At year five, the balance has grown by $4,026, assuming the stated return arrives smoothly. Around year ten, the original balance has approximately doubled. The second doubling takes longer in calendar terms, but the later years add more dollars because growth now applies to a much larger base.
The final figure isn't “profit” in the everyday sense unless you define the assumptions carefully. It's a nominal projection before taxes and inflation, with dividends reinvested. The purchasing power of $76,123 decades later could be lower than its face value suggests.
A well-designed output panel should show:
- Ending balance, the projected account value.
- Total contributions, which equals the original deposit in this example.
- Total growth, the difference between the ending balance and contributions.
- Annualized return, often called CAGR.
- Inflation-adjusted value, if real-return modeling is enabled.
The calculator becomes most useful when you change the return assumption. At 5%, the ending balance is lower than this 7% scenario. At 10%, it's higher. The point isn't to choose the most flattering rate. It's to see how strongly the final result depends on an assumption you don't control.
Worked Example With Monthly Contributions
Now start with $0, contribute $500 each month, invest for 30 years, and use the same 7% annual total-return assumption. Total contributions would be $180,000, while the projected ending balance is near $610,000 under the stated model.
That leaves roughly two-thirds of the projected balance coming from growth and about one-third from contributions. The exact display can vary with contribution timing and periodic-rate conversion, so treat the result as an illustration of compounding rather than a promised account value.
| Year | Total Contributed | Ending Balance | Growth Share |
|---|---|---|---|
| 1 | $6,000 | Model output | Small |
| 10 | $60,000 | Model output | Growing |
| 20 | $120,000 | Model output | Substantial |
| 30 | $180,000 | Near $610,000 | Roughly two-thirds of balance |
The $500 might represent a workplace retirement contribution, an individual retirement account deposit, or an automatic brokerage transfer. That connection matters because the calculator turns an abstract savings habit into a visible long-term trade-off.
The schedule changes shape over time. Month one adds $500 and only a small amount of modeled growth. Month 360 still adds $500, but the existing balance contributes a much larger share of that period's increase. The curve steepens in the back half because the account has had time to build its own growth engine.
This is a cash-flow convention often called dollar-cost averaging. The calculator applies the same assumed return to every deposit, regardless of whether real markets were cheap or expensive on the deposit date. It therefore helps you understand regular saving, but it doesn't prove that monthly investing will outperform investing a lump sum immediately.
A recurring contribution is a useful habit. It isn't a market-timing signal.
The next layer is realism. Inflation, taxes, and fees can reduce what that projected balance means in practice, even when the nominal calculation looks impressive.
Layering in Inflation, Taxes, and Fees
A calculator can apply these adjustments one at a time, so you can see what changes the result. For inflation, it uses a CPI-based factor to deflate a dividend-reinvested total-return series and express the projected balance in the starting period's purchasing power. The inflation-adjustment method is described in this return-calculator methodology.
Taxes depend on the account and the event being taxed. A tax-deferred retirement account may postpone taxation, while a taxable brokerage account can create tax effects from dividends and realized gains. A single blended tax field can support comparisons, but it cannot represent every detail of a tax return.
Use the toggles deliberately
Change one setting at a time. That approach makes each deduction visible:
- Gross nominal: Total return before inflation, taxes, and fees.
- Real value: Gross result after the inflation adjustment.
- Net of fees: Deduct the annual expense or advisory charge.
- After tax: Apply the model's tax treatment to relevant gains or income.
Fees reduce the amount available to compound during every period. A calculator may express them as an annual percentage or as a per-transaction deduction. The distinction matters. An annual charge affects the balance repeatedly, while a transaction deduction applies when a modeled purchase or sale occurs.
Check the methodology before comparing outputs. Trading costs, taxes, and fees may be excluded by default, and a result can look more precise than its assumptions justify. One calculator example explicitly identifies omitted fees, taxes, and trading costs.
| Scenario | Assumptions | Ending Balance | vs. Nominal |
|---|---|---|---|
| Nominal gross | Total return, no adjustments | Highest displayed value | Baseline |
| Inflation-adjusted | Total return less inflation effect | Lower purchasing-power value | Below baseline |
| Net of fees | Gross result less annual fees | Lower account value | Below gross |
| After tax | Model-specific tax treatment | Lower after-tax value | Depends on account |
A 1% annual fee difference over 30 years can move a final balance by tens of thousands of dollars, depending on the starting amount, contributions, and return assumption. That is an illustration of compounding, not a universal outcome. Run the same inputs with both fee settings to see the effect on your projection.
Why Sequence of Returns Can Break the Plan
A calculator can show the same average return for two investors while producing different ending balances. The difference is the order of annual gains and losses. An early decline affects a portfolio differently from the same decline near the end, even if both paths share the same average.
This sequence-of-returns risk becomes more serious once withdrawals start. Selling shares after a fall leaves fewer shares to participate in a recovery. Regular contributions change the result again, because each deposit buys at the market price available at that time. A lump-sum investor has more money exposed from the beginning, while a contributor builds exposure gradually.
Annual history shows why one average return can hide a wide range of outcomes. Since 1928, 72 of 98 full years were positive, while the worst calendar year was -43.8% and the best was +52.6%. Historical research on the S&P 500 describes these annual outcomes and explains the limits of using an incomplete current year.
Stress-test the path
A useful calculator should let you replace a smooth projection with several paths:
- Bad-start case: Put a major decline in the first few years.
- Weak-return case: Lower the long-term return assumption.
- Recovery case: Follow the initial decline with stronger returns.
- Range case: Compare several assumptions rather than choosing one supposedly correct rate.
- Simulation case: Use Monte Carlo analysis when available, while remembering that its results still depend on the selected inputs.
A -30% first-year return is a stress test, not a forecast. It asks whether your contribution and withdrawal plan can withstand an unpleasant beginning. For retirement planning, pair the result with a FIRE calculator to see how changing withdrawals affects the portfolio's path and remaining balance.
Quick Reference for Inputs and Outputs
Use this table as a compact checklist before accepting a projection.
| Field | Type | Default | Who Should Change It |
|---|---|---|---|
| Starting balance | Input | Often zero | Anyone with existing investments |
| Contribution amount | Input | User-entered | Anyone changing savings capacity |
| Contribution frequency | Input | Monthly | Anyone paid or investing on another schedule |
| Expected return | Input | Tool-specific | Everyone comparing conservative and optimistic cases |
| Time horizon | Input | User-entered | Anyone with a fixed goal date |
| Inflation rate | Input | Tool-specific | Anyone planning in purchasing-power terms |
| Fees | Input | Often zero | Anyone using a fund, adviser, or managed account |
| Taxes | Input | Often zero | Anyone comparing taxable and retirement accounts |
| Ending balance | Output | Calculated | Read alongside assumptions |
| Total contributions | Output | Calculated | Check how much you supplied |
| Total growth | Output | Calculated | Compare with contributions |
| Real balance | Output | Optional | Use for future spending power |
| After-tax balance | Output | Optional | Use when account taxes matter |
| Year-by-year schedule | Output | Optional | Turn on to inspect the path |
Edge cases deserve a quick check. A zero-contribution year changes the cash-flow pattern, a very short horizon leaves less time for compounding to matter, and switching deposits from the end of each period to the beginning gives each contribution more time in the model.
Defaults near 2.5% inflation, 7% real return, or 10% nominal return may appear in some tools, but defaults aren't universal. Treat them as starting points, not instructions.
When to Trust the Number and When to Walk Away
Trust an S&P 500 return calculator for relative comparisons, scenario stress-testing, and building intuition about time horizons, contribution sizes, inflation, and fees. It's useful for asking, “What changes if I save more, invest longer, or lower the return assumption?”
Walk away when the result becomes a forecast in your head. A single average return ignores sequence risk, reinvestment assumptions, taxes, fees, and the possibility that a long historical period won't resemble the next one. Revisit assumptions instead of projecting one smooth line indefinitely.
Use a reasonable range of outcomes and keep the tool focused on decisions you control. For a useful discussion of why an expected return should never be treated as a promise, read this financial filings analysis blog. If the money is tied to retirement withdrawals, taxes, or a major life decision, professional advice can matter more than another decimal place in a spreadsheet.
Get more posts like this
One short, useful email each Friday. Free, no spam, unsubscribe anytime.