How Often to Rebalance Portfolio: Calendar vs. Threshold
Learn how often to rebalance portfolio holdings using a calendar, a threshold or both, with worked examples, tax tradeoffs and simple implementation steps.

Daniel Anderson
Editor, The Money Maniac
November 11, 2026
11 min read
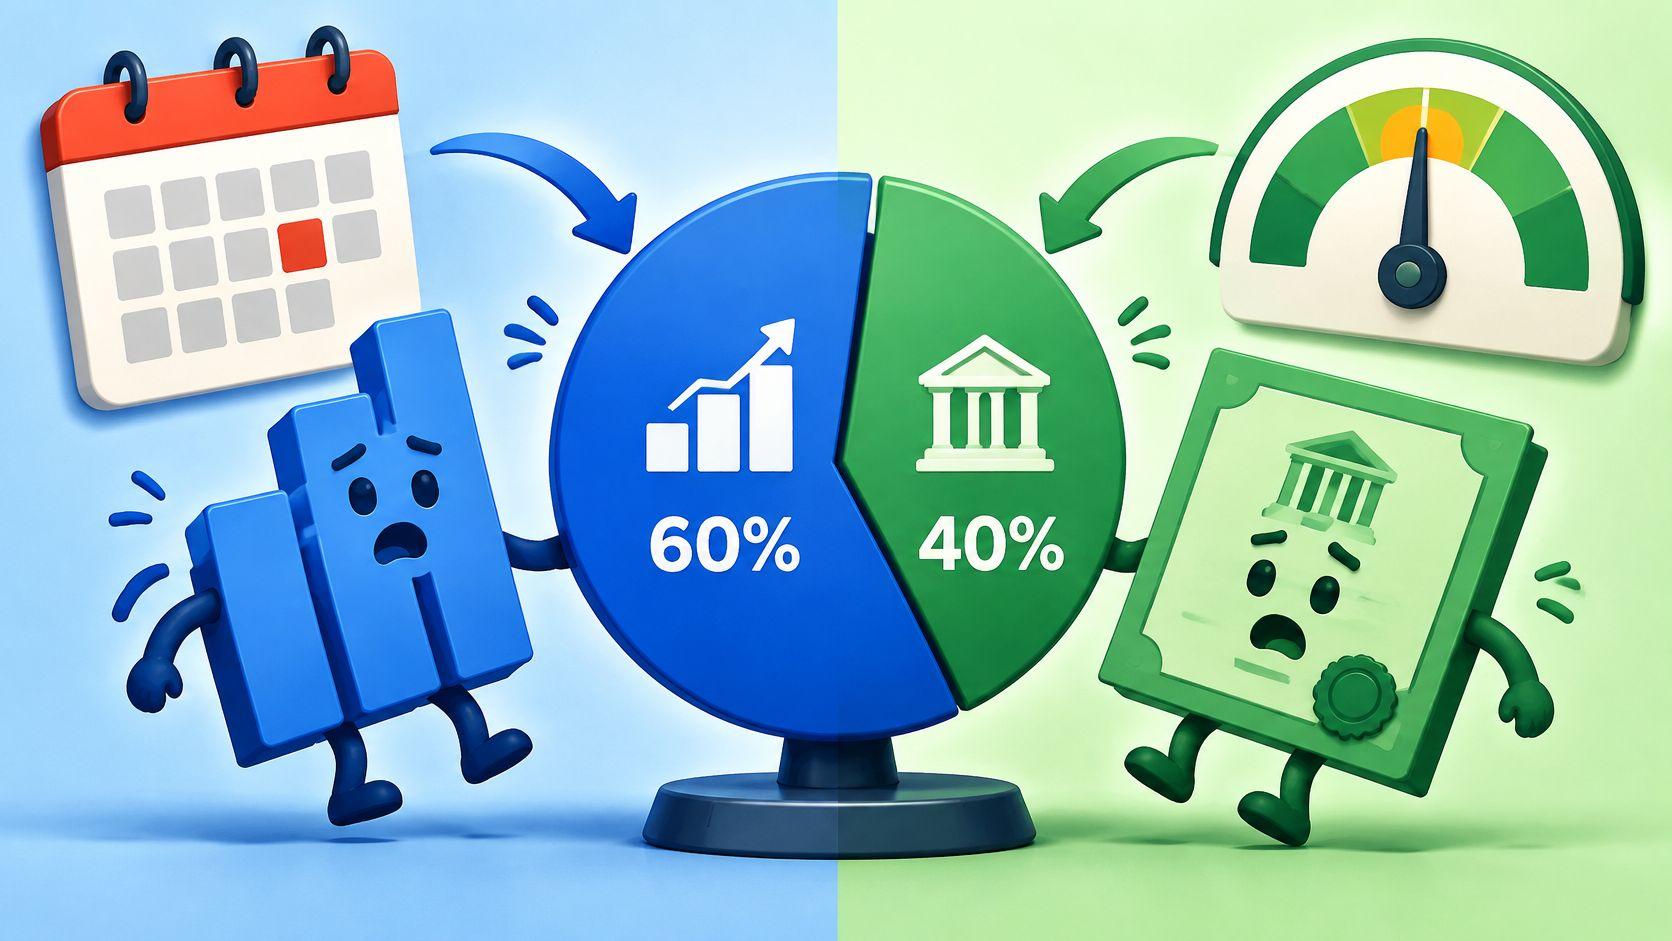
Review your portfolio once a year, and trade only when an asset class has drifted about 5 percentage points away from where you want it. That single rule handles nearly every long-term investor, and it takes about 15 minutes annually once you've built the habit.
A common mistake is treating the review and the trade as a single decision. Rebalancing advice usually merges them, which is why investors either check their accounts every week and fiddle, or ignore the whole thing for six years while a 60/40 becomes a 75/25. Working out how often to rebalance your portfolio is really two questions. When do I look, and when do I act?
Keeping a portfolio near its target risk level is one of the few things in investing you control. The evidence on how often to rebalance portfolio holdings lands in a narrow, fairly consistent place, and it isn't the place most trading apps nudge you toward.
Rebalancing Schedules Compared at a Glance
A schedule should make rebalancing easier to follow, not give you a reason to trade on a quiet month. Calendar rules set a trading date; threshold rules set a drift level that triggers a trade. A hybrid combines regular reviews with a threshold for acting.
The two families of rules
With a calendar rule, you reset the mix on a set date, whether or not it has moved much. With a threshold rule, you check the allocation and trade only when it crosses a band you chose. Calendar rules are simple to remember. Threshold rules can avoid unnecessary trades.
| Schedule | How often you check | When you trade | Main tradeoff |
|---|---|---|---|
| Monthly calendar | Every month | Every month, whatever the drift | Most trades and most tax drag; Morningstar's tests found no clear risk-control gain over annual rebalancing |
| Quarterly calendar | Every three months | Every quarter | More activity than many investors need; slightly weaker risk control than annual rebalancing in Morningstar's tests |
| Annual calendar | Once a year | Every year | Simple to follow; the allocation can drift between reviews |
| Semiannual calendar | Twice a year | Every six months | A middle path; the SEC cites six or 12 months as common review intervals |
| 5-point threshold | Periodic check | When a class is about 5 percentage points from target | Trades only when needed; requires monitoring the weights |
| Time-and-threshold hybrid | Quarterly or semiannual | Only when a band is breached | Pairs regular reviews with a trade trigger; requires a written policy |
What the historical tests actually showed
Morningstar tested six hypothetical 60% stock, 40% bond portfolios beginning on January 1, 1994. The approaches included daily, monthly, quarterly, annual, threshold and buy-and-hold strategies. Its analysis of why rebalancing almost always pays off found that rebalanced portfolios generally had lower volatility and better risk-adjusted outcomes than buy-and-hold.
In the study's most recent 15-year period, Morningstar reported annual rebalancing's annualized standard deviation of 8.55% and downside-capture ratio of 54.12%, while rebalanced strategies as a group had average standard deviations roughly 15% lower than the buy-and-hold portfolio. Daily and monthly rebalancing could lag during long declines because those schedules kept buying assets that were still falling.
These results describe hypothetical portfolios in past periods. They show how the tested rules performed, not what future returns will be.
The takeaway: In Morningstar's tests, annual rebalancing recorded 8.55% annualized standard deviation and a 54.12% downside-capture ratio in the most recent 15-year period. Rebalanced strategies overall had average standard deviations roughly 15% lower than buy-and-hold. See Morningstar's analysis.
Why Drift Matters More Than the Calendar
Drift happens on its own. You make no trades, the statement shows the same funds, and the mix underneath has already moved.
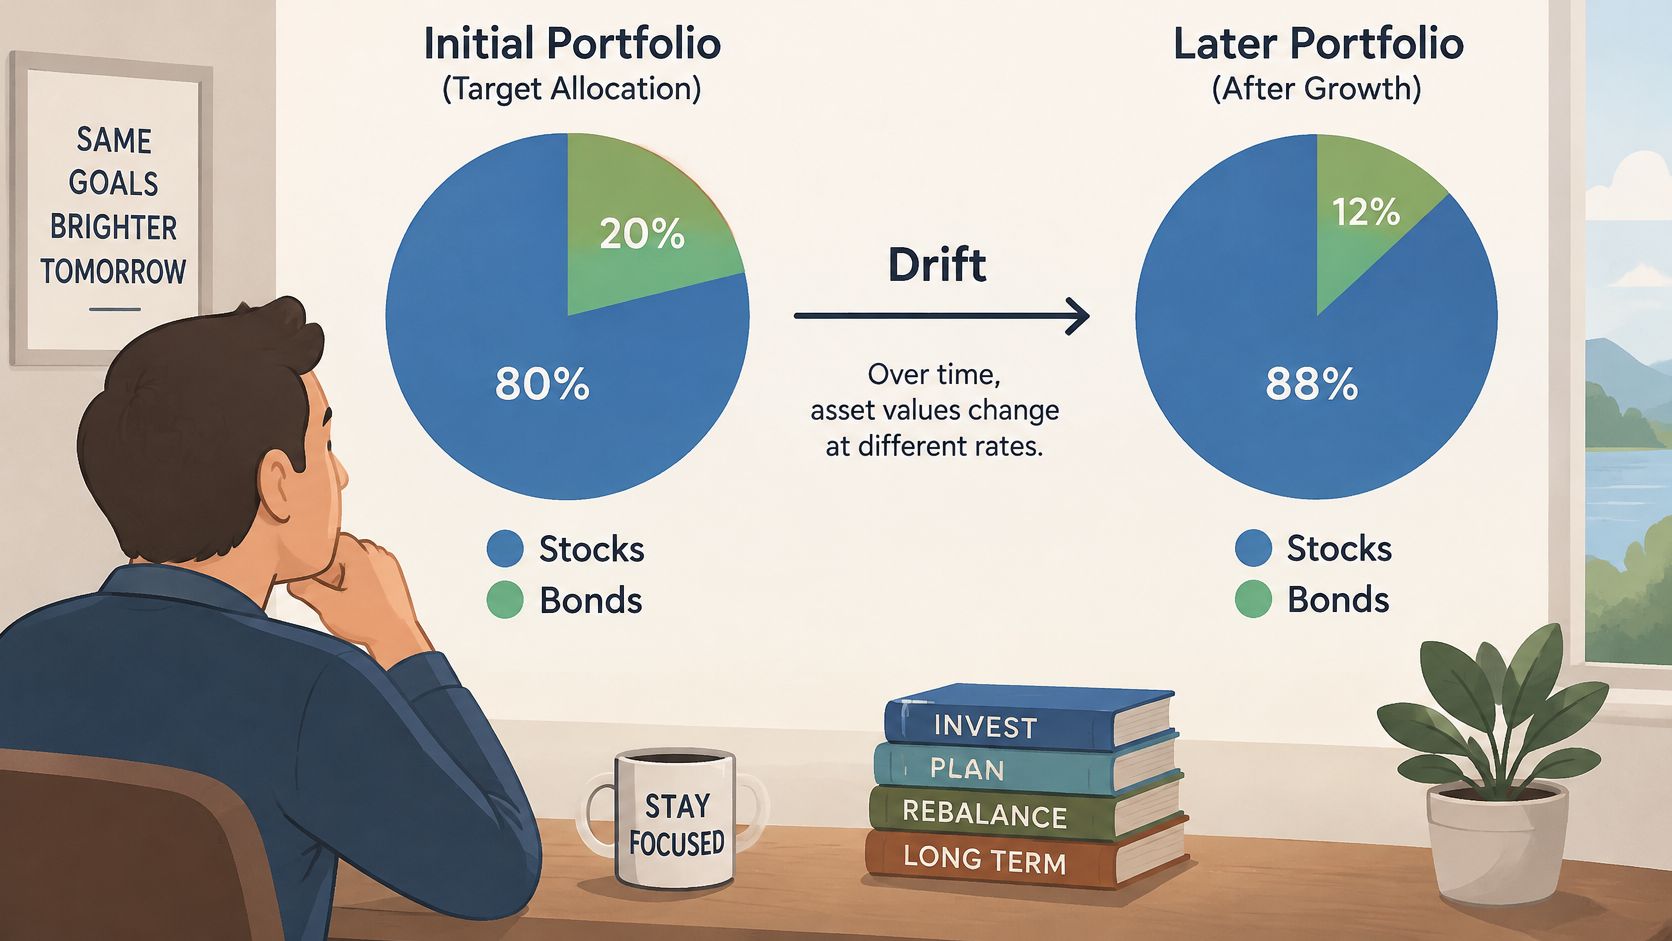
The SEC's note on whether it's time to rebalance uses a plain example: a portfolio that began at 80% stocks and 20% bonds could reach 85% stocks and 15% bonds after a year of market movements. Getting back to the original mix means selling 5 percentage points of stocks and buying bonds with the proceeds.
Nothing about that investor got greedier. Stocks grew faster than bonds, and the portfolio took on more risk than the plan called for. That's the uncomfortable part. A rising market makes the balance look healthy while the risk profile tilts the wrong way, which matters most for someone within a decade of spending the money.
Percentage points versus percent
The distinction trips up smart people. Going from a 60% stock target to a 65% actual weight is a 5 percentage-point drift, but the stock position has grown about 8% larger in relative terms (65 divided by 60 is 1.08). If you set your band in percent instead of points, you're measuring with a different ruler than the one your target weights are written in. Use points.
Setting a band you'll actually follow
Morningstar's analysis found that a 5-percentage-point band around each target produced meaningful risk-control benefits, as laid out in Morningstar's case for rebalancing. Treat that as a starting point, not a universal trigger.
- Conservative mixes: a tighter band makes sense, because a 5-point slip from 30% stocks is a much bigger proportional change than from 80%.
- Aggressive mixes: a wider band keeps you from trading on ordinary noise.
- Concentrated holdings: handle those with a separate written plan rather than a band.
The failure mode is a band so narrow that normal market swings trip it, which turns a risk-control tool into a trading hobby. The arithmetic you need is simple: current weight equals the market value of the holding divided by total portfolio value. Run it for each holding and the drift is sitting right there.
Which Rule Fits Your Situation
The SEC's beginner's guide to asset allocation sets out both options plainly. A calendar-based investor reviews the portfolio at a regular interval, with six or 12 months given as common examples. A threshold-based investor acts when an asset class moves above or below a preset percentage they've chosen for themselves. Neither is wrong. They answer different questions.
| Situation | Rule that fits | Why it works |
|---|---|---|
| 60/40 in an IRA or 401(k), no new money | Annual review; rebalance at about 5 points | Trades inside tax-advantaged accounts do not trigger capital gains tax |
| Taxable account with monthly deposits | Annual review; send deposits to underweight assets first | New money corrects drift, so fewer sales are needed |
| Large single-stock position in a taxable account | Written plan with a wider band and a scheduled sale plan | Selling triggers capital gains, so the timing and size of sales matter more than the band |
| Retiree taking regular withdrawals | Annual review; take withdrawals from overweight assets | Withdrawals act as a rebalancing trade without a separate sale |
Three checks before you choose
Account type changes the math more than any calendar does. A trade inside an IRA or 401(k) generally doesn't create a capital gains tax event; the identical trade in a taxable brokerage account can.
Deposits change it again. If money arrives every month, you already own a rebalancing mechanism that costs nothing to operate.
Concentration is the third check. A single holding that has grown to a third of the portfolio might be a deliberate bet or an accident, and only you know which.
Practical rule: decide what "annual" means to you before you need it, then write it down.
Three meanings of annual
Annual can describe an annual inspection (you look, and may do nothing), an annual reset (you trade back to target every year regardless), or an annual correction using contributions (you steer new money and never sell). They're three different policies with three different tax outcomes. Pick one.
When deposits arrive monthly, send them to the underweight asset first and trade only if the drift persists after a few months of them. If your situation sits between two rows, take the more tax-cautious one. For a fuller picture of how the target itself should shift as you age, our guide to asset allocation by age walks through the mix question before you get to the maintenance question.
Rebalancing Step by Step, With a Worked Example
Five steps, each with a reason attached.
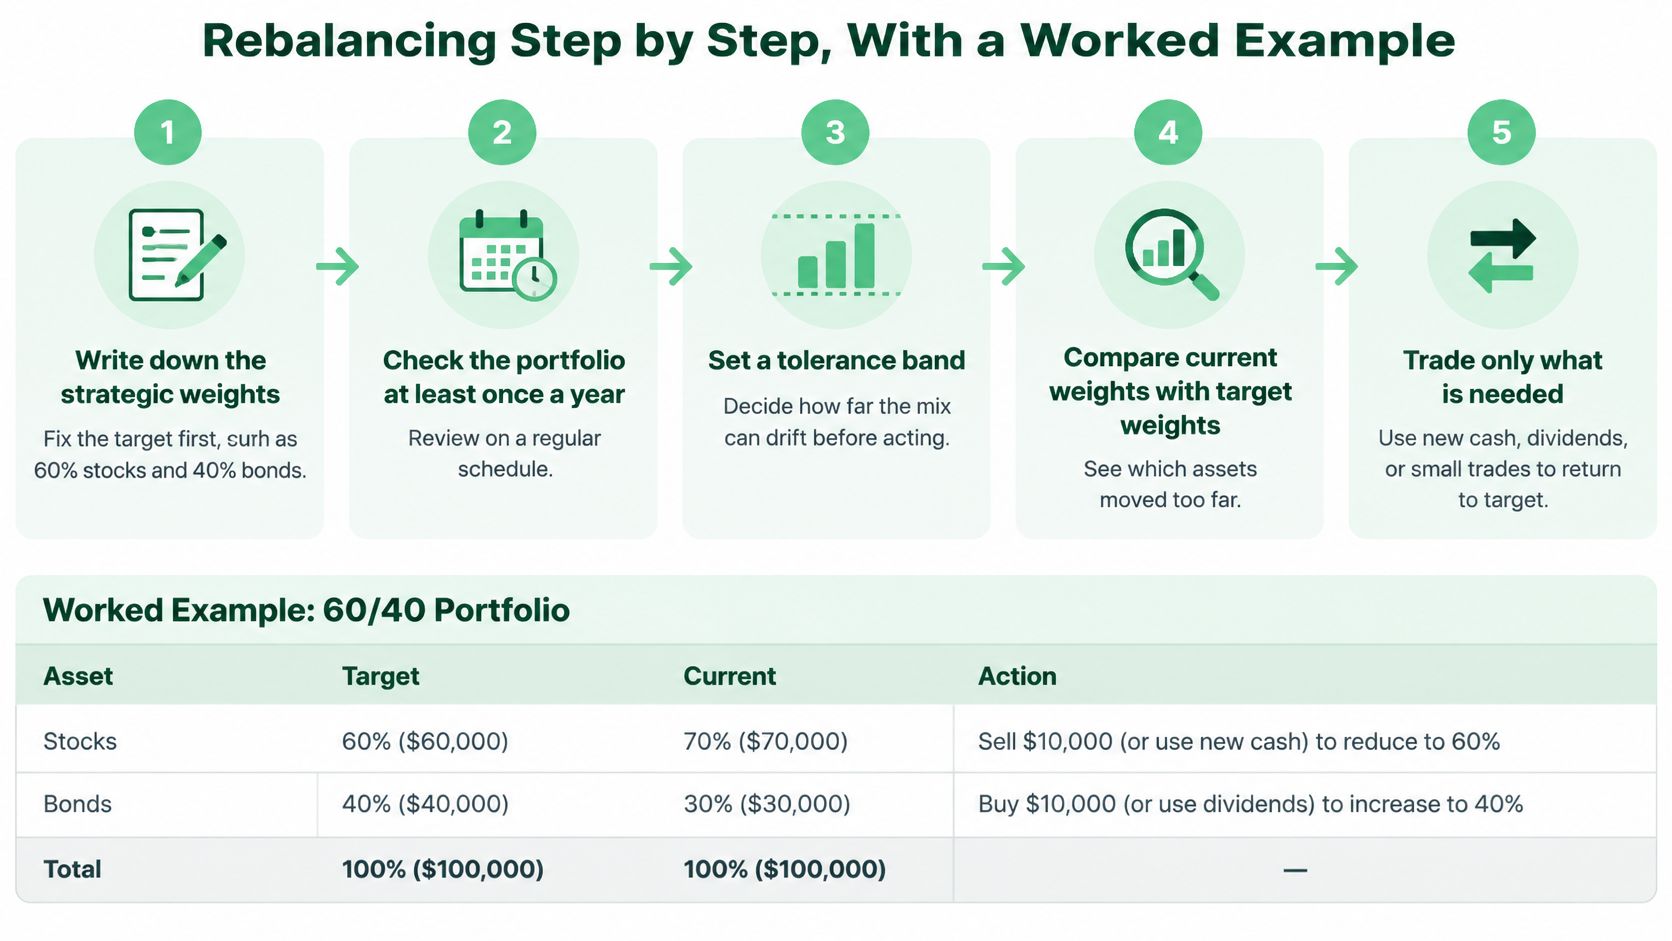
1. Write down the strategic weights. Fix the target before markets move, so the decision isn't made in the middle of a rally. Here, 60% stocks and 40% bonds.
2. Check at least once a year. Calculate each holding's weight as market value divided by total portfolio value. Vanguard's guide to rebalancing your portfolio finds annual rebalancing is generally more efficient than monthly or quarterly schedules, and avoids the long stretches of inactivity that come from only checking every two years.
3. Trade only when a class is materially outside its target, commonly about 5 percentage points, such as stocks reaching 65% or falling to 55%. The band is what stops you from reacting to ordinary noise.
4. Send new contributions, dividends and withdrawals to underweight assets first. Cash flow is the cheapest trade available. The SEC's bulletin on ways to rebalance lists three methods: sell overweight assets to buy underweight ones, direct new purchases toward the underweight category, or adjust ongoing contributions until the mix is restored.
5. When a sale is necessary, restore the target or a defined destination range. Deciding the endpoint in advance prevents the classic half-rebalance that gets abandoned.
The same portfolio, two endings
A $100,000 portfolio holds $60,000 in stocks and $40,000 in bonds. Stocks rally 25%, taking that sleeve to $75,000 while bonds stay at $40,000. The total is now $115,000 and stocks are 65.2% of it, a drift of about 5.2 percentage points, past the band.
Restoring 60% means a stock target of $69,000, so you sell $6,000 of stocks and buy $6,000 of bonds. Two trades and you're done for the year.
Now the version where cash flow does the work. If that same rally had been paired with $1,000 a month flowing into bonds for six months, bonds reach $46,000, the total is $121,000, and stocks sit near 62%. Inside the band. No sale, no realized gain, no tax paperwork. Market moves during those six months are ignored here to keep the arithmetic readable.
| Holding | Start | After stock rally | After rebalance |
|---|---|---|---|
| Stocks | $60,000 (60.0%) | $75,000 (65.2%) | $69,000 (60.0%) |
| Bonds | $40,000 (40.0%) | $40,000 (34.8%) | $46,000 (40.0%) |
| Total | $100,000 | $115,000 | $115,000 |
If you're still deciding what belongs in the stock sleeve in the first place, our explainer on what index fund investing involves covers the basics before you worry about nudging the weights.
Taxes, Fees and What Frequent Trading Costs
Frequent rebalancing can create costs that are easy to miss. Transaction fees may apply when you buy, sell or exchange an investment, and ongoing fees also reduce portfolio returns, according to the SEC's investor bulletin on fees and expenses. Selling an appreciated holding in a taxable account can also realize a capital gain and create a tax bill. Check those costs before placing a trade.
In an IRA or 401(k), trades generally do not trigger capital gains tax. That makes the account where you trade a practical part of your rebalancing decision.
The levers that cost nothing
- Use sheltered accounts for sales: When a sale is necessary, consider whether you can make the trade in a tax-advantaged account instead of realizing a gain in a taxable one.
- Choose asset location deliberately: Holding income-heavy assets in tax-advantaged accounts and growth-focused assets in taxable accounts can make the portfolio's tax treatment more efficient.
Fewer trades, more drift
Tracking error is the gap between your actual portfolio mix and its target. Wider rebalancing bands usually mean fewer trades and longer periods away from target. Narrow bands can prompt repeated trades after ordinary market swings, adding fees and potentially realizing taxable gains. Choose a band that reflects how much drift you can accept, not how active you want to be.
A taxable sale deserves a calculation before you place it: estimate the gain, then weigh the resulting tax against the benefit of bringing the portfolio closer to target. Our guide to tax gain harvesting explains how realized gains and losses interact across the year.
Manual or Automated Rebalancing Without Overthinking It
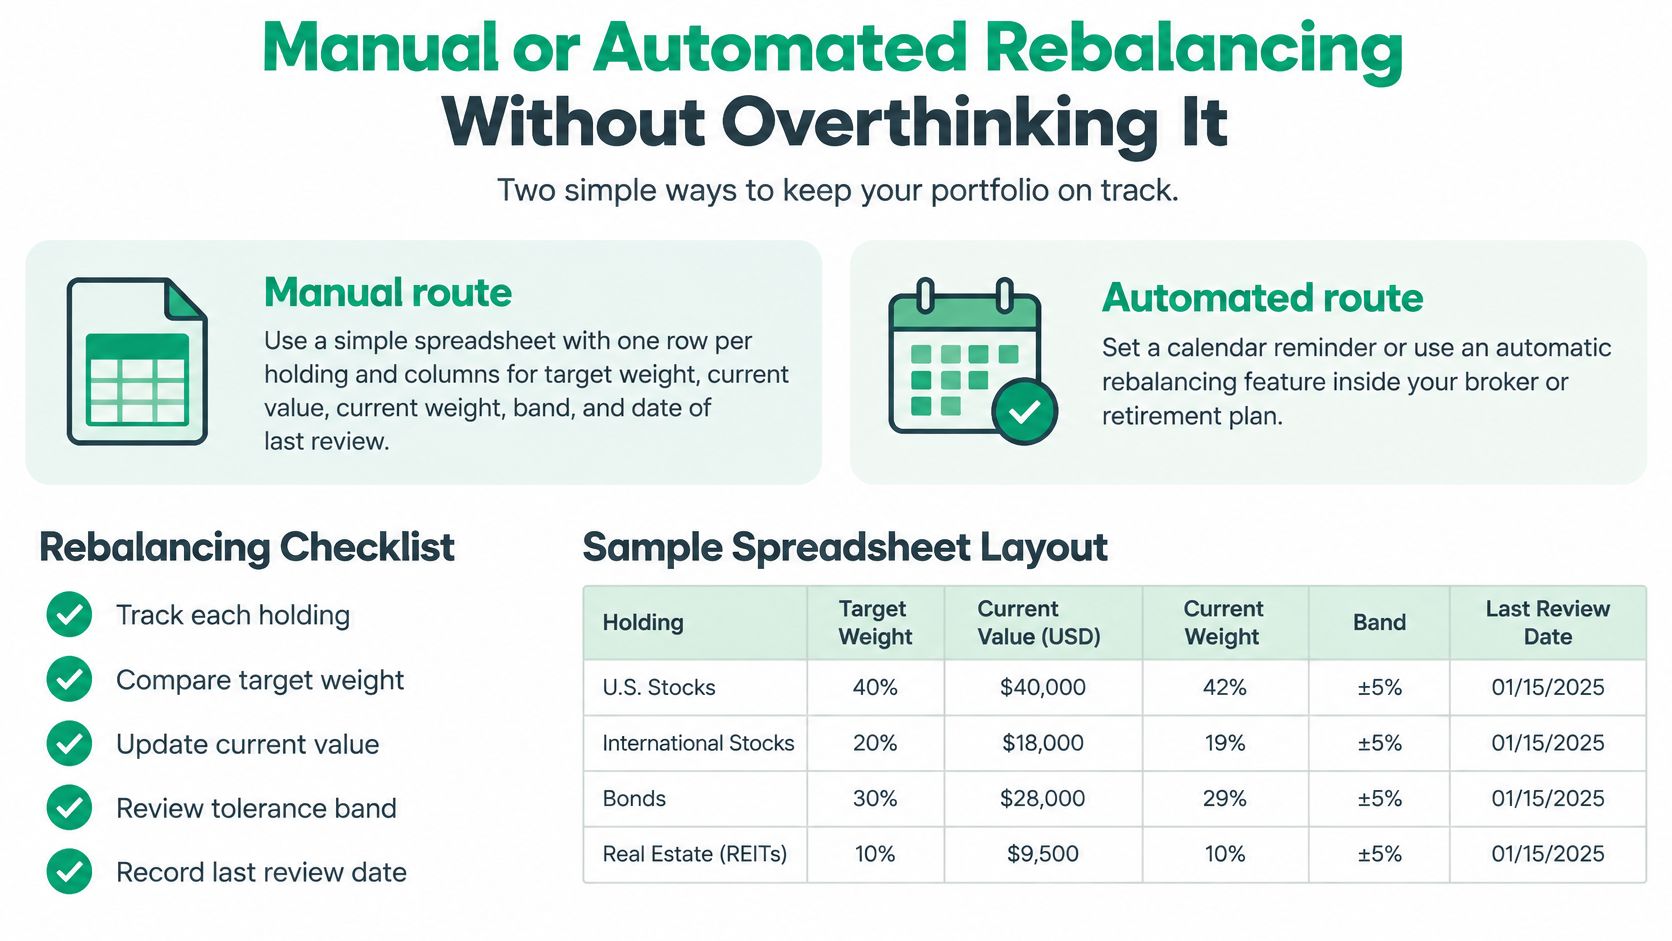
The manual route
Build a spreadsheet with one row per holding and columns for target weight, current value, current weight, band and date of last review. Set a calendar reminder for the annual check. That review takes about 15 minutes once the sheet exists, because the formulas do the division and you do the judgment.
Log each decision and its reason in the same sheet. Next year's review then has a record to argue with, which is more useful than your memory of why you sold something in March.
Settings to check in an automated plan
Many brokerages and robo-advisors offer rebalancing that runs on a calendar or inside a band. Treat yours as a set of settings rather than a feature. Morningstar's review of how rebalancing helped investors makes the case that a documented annual decision rule is what keeps retail investors from emotional timing, so confirm what triggers a trade in your account, whether it sells taxable holdings without asking, whether you get an alert first, and whether new deposits go to underweight assets before anything is sold. Automation removes the emotion, and it can also realize gains you never planned for.
If crypto sits alongside your brokerage accounts, pulling wallet-level holdings into one view solves the same problem, and these Solana wallet portfolio API resources show how that kind of position tracking works so your total allocation isn't guesswork spread across four apps.
Pick Your Rule and Book the First Review
Here's the verdict. For a diversified 60/40 or similar mix sitting in tax-advantaged accounts, an annual review with a 5-point band is a defensible default, and it's what I'd use. For a taxable account with regular deposits, keep the annual review but steer deposits to the underweight asset before selling anything. For a large single holding, write a separate plan; forcing an inherited position or a concentrated stock into a tidy band usually ends with a tax bill you didn't need.
Five things to do this week:
- Write your target mix as percentages.
- Choose a band, starting near 5 points if you're unsure.
- Pick a review date you will keep, and put it in the calendar.
- Run the first check, calculating each weight as market value divided by total portfolio value, and record the results.
- Log the decision and the reason, even if the decision is "do nothing."
Some honest limits. The historical tests are hypothetical portfolios over past periods, and a rule that produced lower volatility in those windows can still underperform for years in the next one. Nothing here forecasts returns or removes risk from owning stocks. Large embedded gains, estate questions and multi-account coordination are worth a conversation with a fee-only advisor or a tax professional rather than a spreadsheet.
Where the evidence is strong: rebalancing less often than you think keeps your risk profile intact. Where it's silent: whether the next decade rewards the trade or punishes it.
If you want to understand whether a stretch of drift reflects ordinary market noise or something bigger moving underneath it, whale activity analysis articles cover how large holders shift positions and what those flows tend to precede. Read them for context, not for a signal to trade. As a publisher, we advise readers to do their own research or consult a licensed professional before making any investment decisions.
Get more posts like this
One short, useful email each Friday. Free, no spam, unsubscribe anytime.