Can I Retire with 1 Million? What It Pays Each Year
Can I retire with 1 million? It depends on spending, retirement length, taxes and healthcare. See the withdrawal math and worked examples.

Daniel Anderson
Editor, The Money Maniac
November 10, 2026
13 min read

About $39,000 a year. That is what a $1 million portfolio supports in first-year withdrawals at a 3.9% starting rate, with a 90% chance the money lasts a 30-year retirement, according to Morningstar's 2025 retirement-income research. That figure settles nothing by itself. $1 million is enough only if the spending left over after Social Security, pensions, and taxes stays under it.
In 2024, 35% of Americans said they expected to need more than $1 million to retire comfortably, according to Bankrate survey data reported by CNBC. The round number has become a finish line. For households between 50 and 70, it is the wrong scoreboard.
Your portfolio does not have to fund your life. It has to fund the gap: whatever Social Security, a pension, and other steady income leave uncovered, after tax, with a buffer for a bad market in the early years and for health premiums that arrive before Medicare does.
Own your home outright and that gap is often smaller than the lifestyle the headline seems to promise. Still carry a mortgage, high property taxes, or a decade of private insurance ahead, and the same balance thins out fast.
So do the subtraction first. Add up your guaranteed income, tax what remains of your spending, and what is left is the only number your $1 million has to answer to.
What $1 Million Pays Out Each Year
A million dollars can fund a comfortable retirement for one household and a strained one for the next. The first-year withdrawal number shows which household you are.
Morningstar's 2025 retirement-income research estimates that a new retiree who wants inflation-adjusted spending and a 90% probability of keeping a diversified portfolio alive for 30 years could start at a 3.9% withdrawal rate, about $39,000 in year one, while a flexible start near 5.7%, roughly $57,000, is reserved for retirees who will cut spending after weak markets and accept that nothing about it is guaranteed.
That $39,000 is the cautious line, and a 90% success probability still leaves one scenario in ten where the money runs short. Social Security, pensions, taxes, and healthcare sit outside the figure, because the portfolio's job is narrower than paying for your life. It covers the gap those other income sources leave. A household that needs $70,000 a year from investments alone sits at a 7% start, nearly double the 30-year baseline.
| Starting withdrawal rate | First-year income | Where the number comes from |
|---|---|---|
| 3.0% | $30,000 | Simple calculation, a conservative planning rate |
| 3.5% | $35,000 | Simple calculation, a middle-ground planning rate |
| 3.9% | $39,000 | Morningstar 2025 baseline: 30 years, 90% success |
| 4.0% | $40,000 | Traditional 4% rule, shown for comparison |
| 5.7% | $57,000 | Flexible spending only, not guaranteed |
| 7.0% | $70,000 | Needed to fund $70,000 entirely from investments |
Every amount in that column is before tax and fees. Inflation raises each later withdrawal, so a plan that looks comfortable in year one has to stay comfortable in year fifteen. Shorter and longer horizons shift the starting rate, and that trade-off gets its own treatment later in this article.
Match your gap to a row
Find the dollars your investments must supply each year, then read across. A rate near 3.9% is the cautious 30-year line. The familiar 4 percent rule for retirement works as a comparison row here, since its original research assumed a 30-year horizon and a specific market era. The 5.7% row belongs only to people who will spend less after a bad market, year after year, rather than once. The 7% row is a warning.
Some households shrink the gap with lifetime income instead of a higher draw. SPIA guidance from Kons Law explains how a single premium immediate annuity converts a lump sum into a payment stream, and what you give up for that certainty. Treat it as a contract to understand before you commit money to it.
Practical rule: Compare the annual amount you need from investments with the matching row. Ignore the round number on the statement until that comparison is done.
The Spending Test That Settles It
A $1 million balance tells you very little until you know what it has to cover. The portfolio only funds the gap between your spending and the income that arrives without it, plus the tax each withdrawal creates and a cushion for shocks and health premiums in the years before Medicare. Four steps produce that number, and the inputs come from last year's statements rather than a hopeful budget.
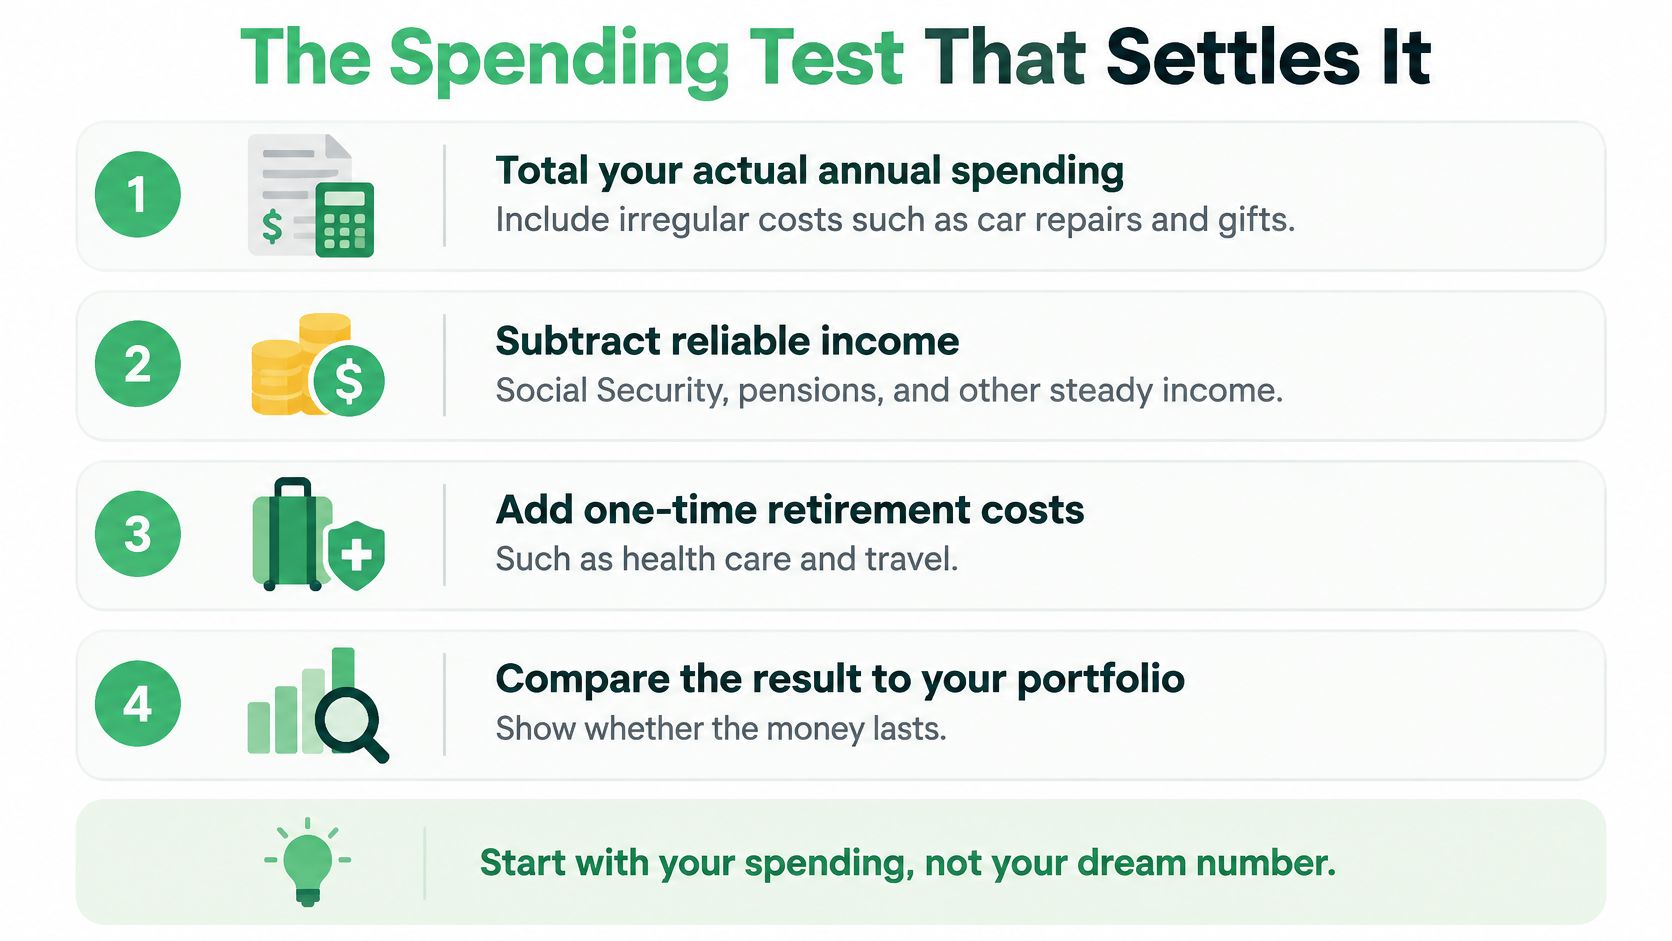
- Total real spending. Add twelve months of housing, food, insurance, cars, gifts, and the lumpy stuff: a roof, a transmission, a trip to see the grandkids. If the mortgage ends before you stop working, that payment drops out. If the loan runs into retirement, it stays, and your required rate goes up.
- Subtract reliable income. Social Security, a pension, annuity payments, and rent you receive. Do not subtract a hope that you will work "a little."
- Add the tax the withdrawals create. A dollar from a traditional IRA is not a dollar you can spend.
- Divide by $1 million. That percentage is your starting rate. Set it next to the table above.
Say you spend $60,000 and Social Security pays $25,000. The portfolio supplies $35,000, a 3.5% rate. That sits inside a cautious 30-year plan, before a surprise bill.
Use averages only to sanity-check your own number. The U.S. Bureau of Labor Statistics reported that households headed by people born in 1945 or earlier spent an average of $49,206 in 2023. Dividing that spending by $1 million works out to about a 4.92% starting rate before taxes, fees, or surprises, roughly $10,206 above a $39,000 first-year baseline. In the same BLS data, households born from 1946 to 1964 averaged $70,207, and those born from 1965 to 1980 averaged $95,692. National figures bundle in other people's housing costs, debt loads, and guaranteed income, so treat them as a range check and nothing more.
Five households, one balance
| Household | Yearly spending | Income the portfolio must supply | Rate on $1 million |
|---|---|---|---|
| Lean budget with $20,000 guaranteed income | $50,000 | $30,000 | 3.0% |
| Mid budget with $25,000 Social Security | $60,000 | $35,000 | 3.5% |
| Mid budget with $30,000 Social Security | $60,000 | $30,000 | 3.0% |
| Full $70,000 from investments, no guaranteed income | $70,000 | $70,000 | 7.0% |
| $50,000 spending plus $5,000 tax, no guaranteed income | $55,000 | $55,000 | 5.5% |
Read the second and third rows together. Identical spending produces different rates depending on how much guaranteed income covers, which is why the size of your Social Security benefit matters as much as the size of your portfolio. The last two rows show what happens when investments carry the full load: every dollar of spending and tax comes straight out of the withdrawal rate.
Housing belongs on line one because it moves the rate more than almost any other bill. A paid-off house with a modest tax bill can drop you from the 7% row toward 3.5%. A loan plus high property taxes can push you the other direction even if your groceries look frugal.
A rate at or under the baseline leaves room for a shock. A rate well above it means you cut spending, add income, or build a larger cash buffer before you quit. There is no third option hiding in the account title.
How Retirement Length Changes the Number
Retire at 65 and the spending gap may need funding for about 25 years. Retire earlier and the same gap can stretch decades longer.
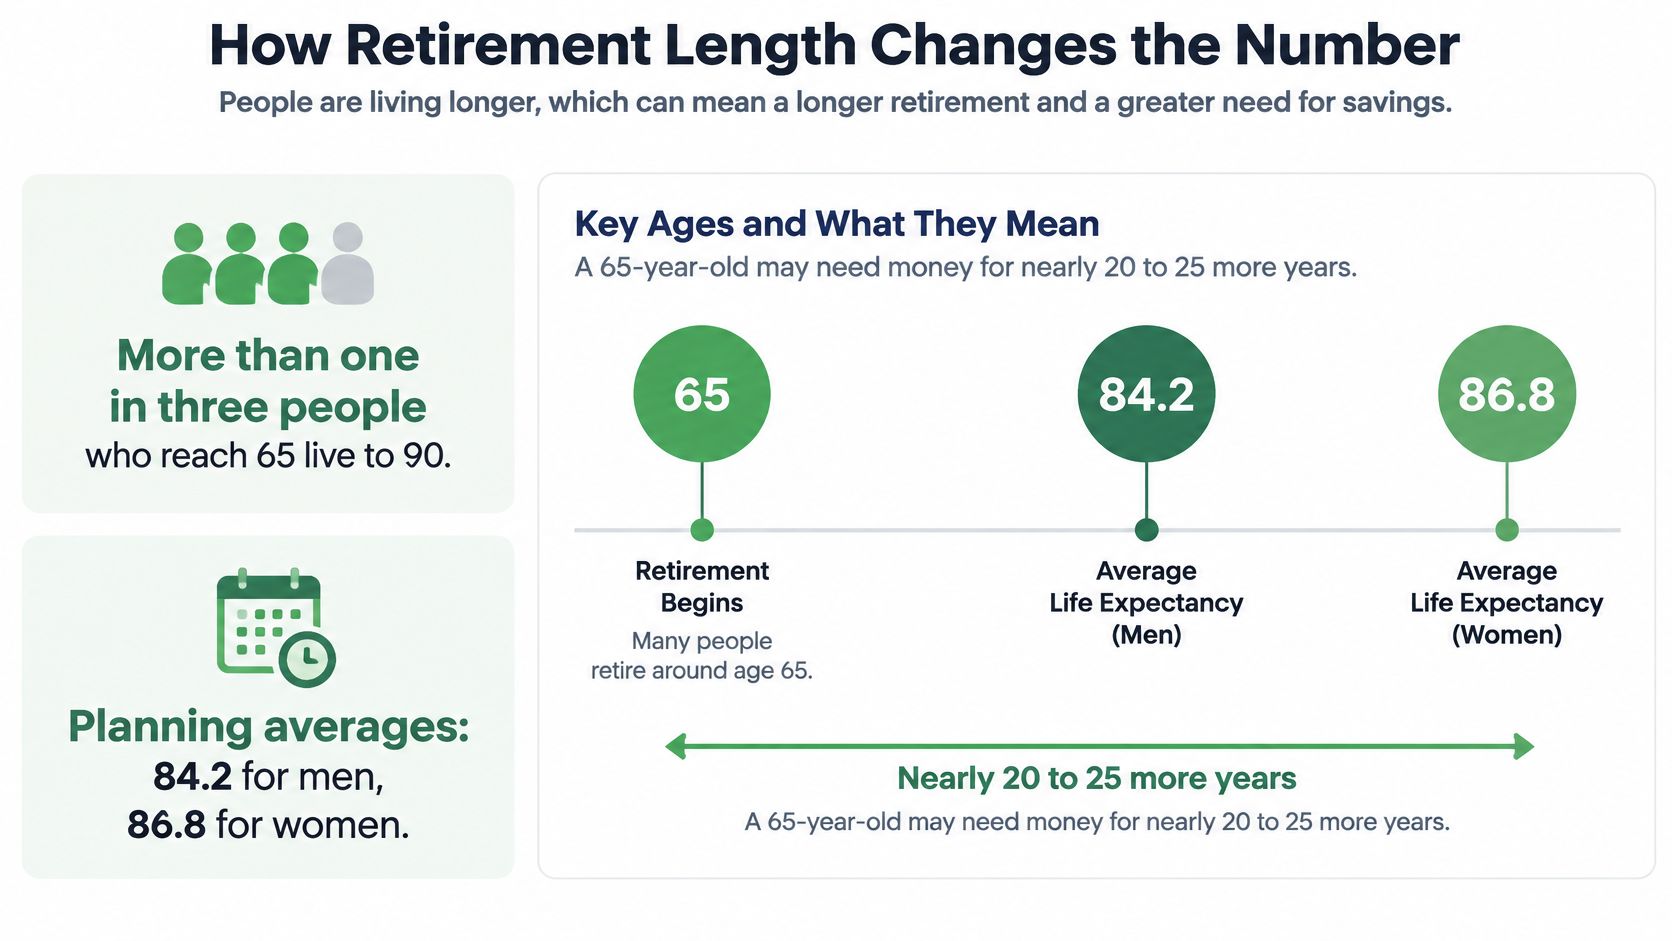
Social Security Administration planning material reports that more than one in three people who reach 65 will live to 90, and it puts average life expectancy at 65 near 84.2 for men and 86.8 for women. Use the long end for planning. A short plan feels safe until year 26 shows up.
The million stays invested while you spend from it, so the danger is concentrated early. Morningstar's 2025 modeling shows the starting rate sliding as the horizon stretches, down to about 2.9% for 50 years, or $29,000 on $1 million before tax. That smaller start is the price of a longer runway.
The first decade is the danger zone. If your gap is $30,000 after guaranteed income and the market drops in years one through five, you are selling more shares at lower prices while the bills keep arriving. Losses taken then have less time to recover, and every later rally is working on a smaller base.
Someone who stops at 50 should test 40 and 50 years, not a tidy 30. On $1 million, 2.9% is $29,000 before tax, so the old 4% habit does not travel unchanged to that age. Keep a cash buffer for shocks and for the years before health coverage settles, because those costs arrive while the portfolio is still finding its footing.
Claiming age changes the guaranteed check, so it changes the gap the portfolio must cover. Health, a spouse, and cash needs decide that trade. For a 65-year-old, 90 is the floor. Pick a planning age you would not be embarrassed to tell a doctor, rerun the spending test at that horizon, and check a current Morningstar update before locking a retirement date. Length leaves the test unchanged and raises the price of getting the first decade wrong.
Social Security, Taxes and the Money You Keep
Every dollar of Social Security is a dollar the portfolio does not have to produce, and it lasts as long as you do.
SSA planning tools let you compare estimates at 62, at full retirement age, and at 70. Benefits do not run out the way an account can. Suppose you spend $60,000 and Social Security pays $30,000. The portfolio covers $30,000, a 3% start on $1 million. Delay the benefit and the portfolio carries more of the early years, then less later, because the monthly check is larger for life. Claim early and you get cash sooner, locked in at a lower amount. Our guide on when to take Social Security lays out that trade against health, a spouse, and whether you need the check now.
Say the full-retirement-age benefit in that example slipped because you claimed early. A smaller check pushes more of the $60,000 onto the portfolio, and the rate climbs toward the cautious 30-year line even though spending never changed. Family history and how you live belong in that choice. SSA treats them as planning inputs, not a personal prediction.
The tax layer most calculators skip
Account type changes the spendable dollar. A withdrawal from a traditional 401(k) or IRA is generally ordinary income. A qualified Roth withdrawal can come out differently when the account and distribution rules are met. A taxable brokerage sale is taxed on the gain, not the whole sale. Same million on the statement, different lifestyle after April.
Walk one household that skips guaranteed income. You need $50,000 to live and expect $5,000 of tax. The portfolio must supply $55,000, a 5.5% start. That is a much harder job than a 4% sketch on a napkin. Pretax balances also face required distributions later, and those withdrawals can raise how much of your Social Security is taxed. Map each account by year before you lock a claiming age. The spendable number, not the balance-sheet number, is the one that pays the bills.
Health Costs Before Medicare and in Later Life
Retiring at 55 means paying for your own health coverage for a decade. Medicare generally starts at 65. Social Security and a pension, if you have them, cover only part of the household budget. The portfolio has to fund the rest, after tax, and still hold a buffer for a bad health year.
Morningstar's retirement-income working file put 2025 marketplace premiums around $800 to $1,200 a month and COBRA around $700 to $1,500. At a 3.5% withdrawal, $1 million produces $35,000 before tax. A $1,000 monthly premium consumes roughly a third of that draw before a deductible or a prescription.
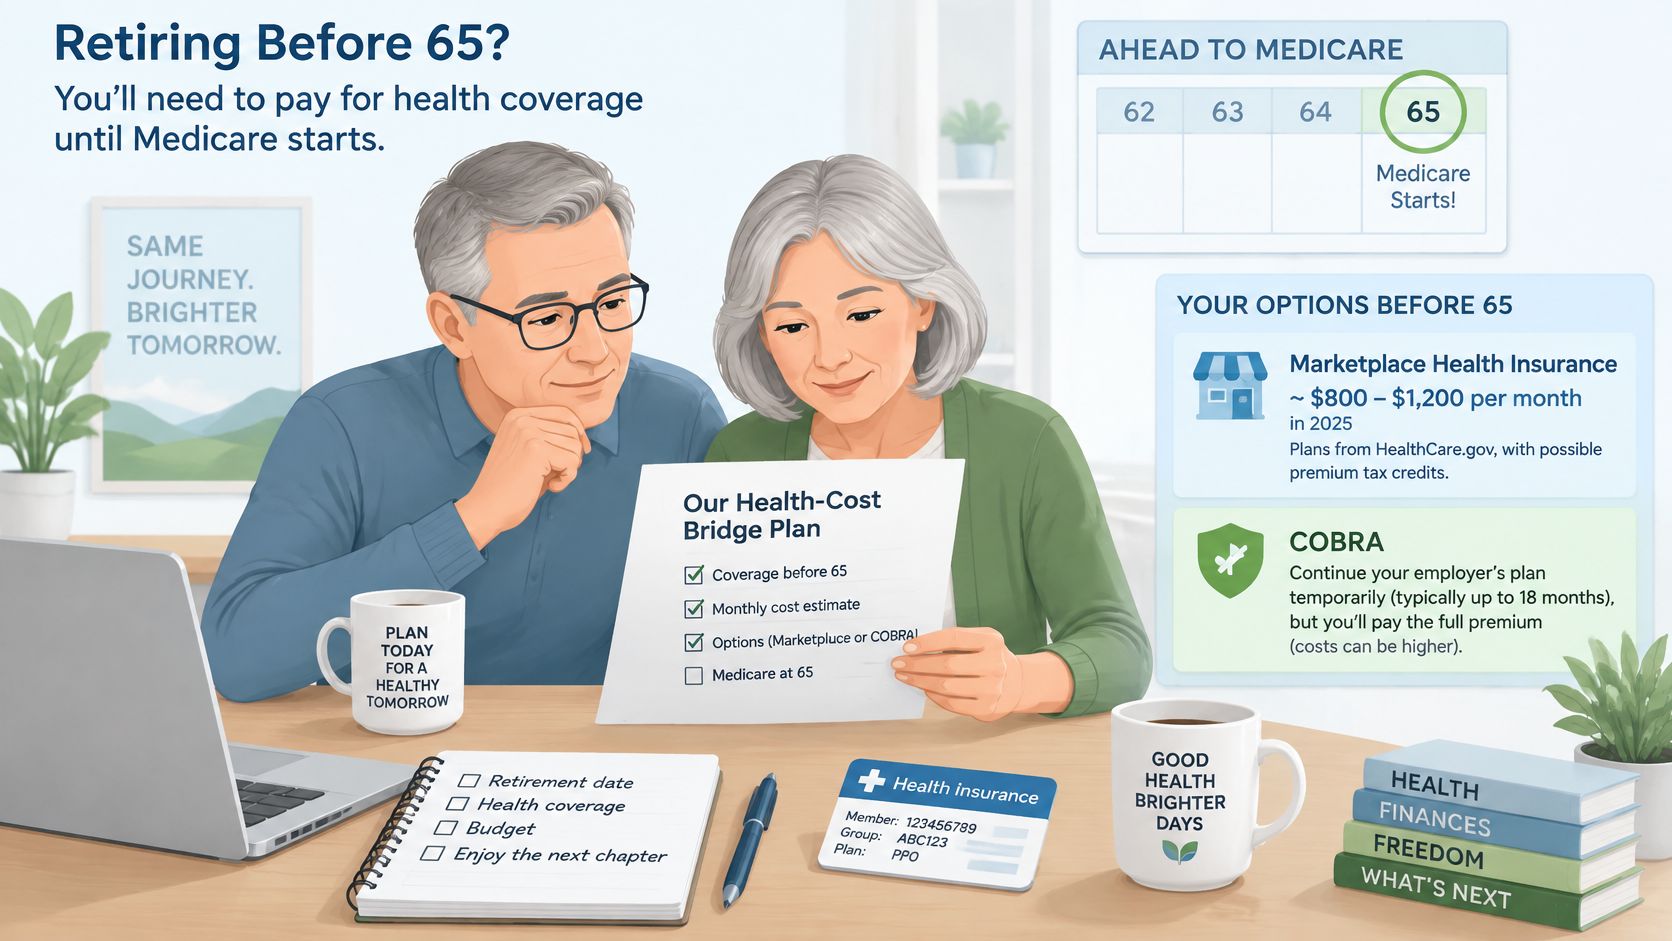
Premiums move with age, income, state, and plan. The rows below apply those Morningstar monthly bills to the same $35,000 draw. They are a range, not a quote. Subsidies tie to income, so the mix of IRA withdrawals and other cash can change the bill. Check this year's marketplace prices for your zip code before you treat 2025 as permanent.
| Monthly premium | Share of a $35,000 draw |
|---|---|
| $700 | 24% |
| $800 | 27% |
| $1,000 | 34% |
| $1,200 | 41% |
| $1,500 | 51% |
A $12,000 premium year is gone before deductibles and prescriptions. "I have a million" is a weak answer to "I want to stop at 58."
Care that Medicare does not fully cover
Long-term care is a separate line. People who die in their mid-70s are much less likely to have needed extended care than people who live into their mid-90s, and women face that risk more often than men.
A couple with the house paid off and solid public benefits can often absorb a stretch of help. A single person paying private rates for many years often cannot, even with the same account balance. Life Senior Placement explains Medicare limits on assisted living, which is the gap families discover after a hospital stay, not before.
Run the years in order. Pick 55, 62, or 65. Price the bridge premiums and the tax on the withdrawals that pay them. Then model long-term care and a surviving spouse as their own cases. If the bridge alone eats a third of the draw, move the date or cut spending, and keep cash aside so one hospital year does not force a larger withdrawal.
Protecting the Portfolio From a Bad Start
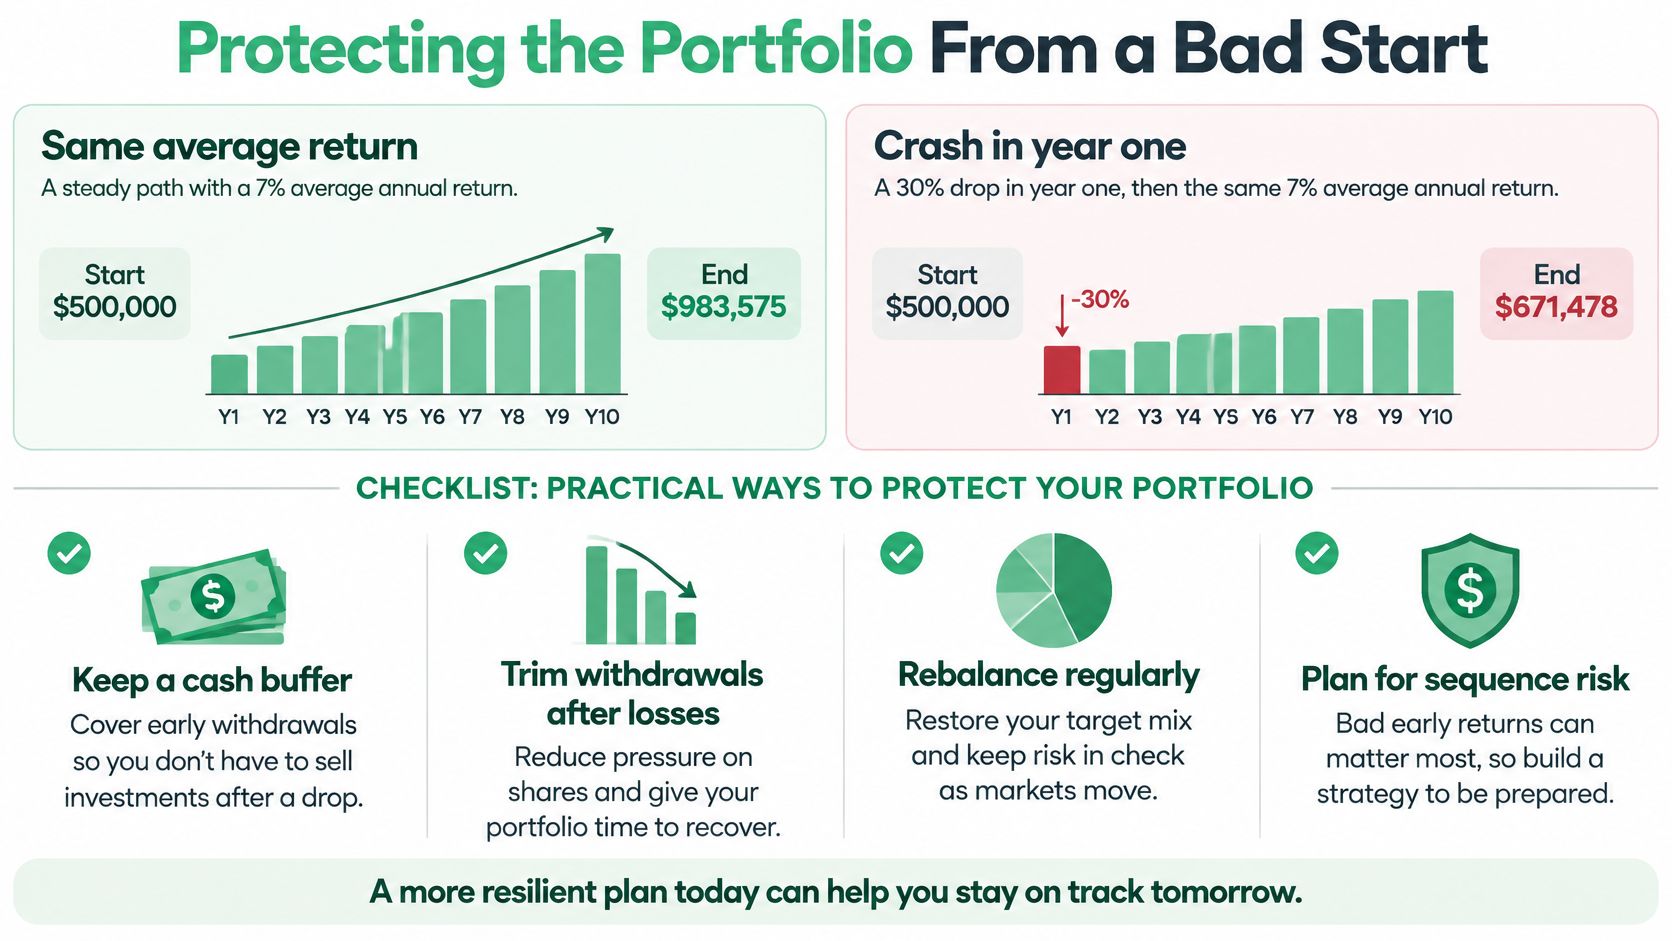
Two retirees can earn the same average return over 20 years and finish in different places. The one who meets a crash in year one sells more shares at low prices to pay the bills. Fewer shares are left when the market recovers. That is sequence-of-returns risk, and our explainer on what sequence of returns risk means is worth reading before you set the first withdrawal.
Spending rarely stays smooth either. Research using the Health and Retirement Study, summarized by LIMRA, found that roughly one in four retirees had at least a 17% to 20% spending increase over two years, while another quarter had at least a 20% to 21% decrease. Home costs were the largest source, then healthcare and transportation. A roof in year two, on top of a down market, is how a plan that looked fine on a straight line gets hurt.
A buffer in three parts
- Baseline budget: Essentials only, the bills you will not skip. This is the number you protect first.
- Irregular reserve: A separate pile for a roof, a car, or help for family. Do not pretend those costs are "emergencies" if you can see them coming once a decade.
- Spending cash: One to several years of planned withdrawals in cash or high-quality short-term bonds, so you are not forced to sell stocks in a slump. Inflation and reinvestment risk stay. Yields move, so check current Treasury bill yields before you size that pile. A rate from last spring is not a fact about next spring.
Stocks still have a job, because a multi-decade retirement that sits entirely in cash loses purchasing power. More stocks can deepen a drawdown. The point of the cash sleeve is time, not a forecast.
Add a spending trigger you write down while markets are calm. One simple version is to skip the inflation raise after the portfolio drops about 20%. You are choosing a smaller lifestyle hit on purpose, instead of discovering it when the brokerage screen is red.
In 2024, 31% of U.S. retirees aged 62 to 75 said their spending was higher than they could afford, according to the Employee Benefit Research Institute's Spending in Retirement Survey. A buffer does not make you immune. It keeps a bad first year from becoming a permanent cut you did not choose.
Run Your Own Numbers Before Setting a Retirement Date
Pick a date only after your gap fits a horizon row. The portfolio does not have to pay the whole lifestyle. It has to cover what Social Security and any pension leave unpaid, after tax, with a buffer for shocks and for health premiums in the years before Medicare.
Stopping before 62 while private premiums are still on the bill makes that gap a stretch. So does long-term care for one person who has no other income to pay for it. Leave either bill out and you will move the date later.
Use the spending test, then stress the first year: raise spending 20% and drop the portfolio 20%. Treat a plan that fails that stress as unfinished. Wait, save more, or cut spending until the stressed gap still fits the horizon you chose.
If you are not at $1 million yet, our Compound Interest Calculator shows how a lump sum and monthly contributions grow with compounding, so you can see whether the date moves by saving more or by spending less. If you are selling a business to fund this, planning retirement around your business sale is a useful companion, because the sale proceeds and the spending gap have to be solved together.
What you read on our site is for information, not advice from a certified financial or legal expert. Do your own research, or sit down with a licensed fee-only advisor or tax professional, before you set the date. This week, take last year's bank statements, compute the gap, and run that 20% stress. That worksheet answers "can I retire with 1 million" better than any round number will.
Get more posts like this
One short, useful email each Friday. Free, no spam, unsubscribe anytime.