What Is Sequence of Returns Risk? a Plain-English Guide
What is sequence of returns risk? See how the order of market losses can drain a retirement portfolio, compare real scenarios and learn how to protect yours.

Daniel Anderson
Editor, The Money Maniac
October 25, 2026
13 min read

Sequence of returns risk is the danger that the order of investment gains and losses, combined with withdrawals, depletes a portfolio even when its average return looks acceptable. During a 30-year retirement, poor returns near the beginning can leave you with too little invested to benefit fully from a later recovery.
You may already have a retirement balance in mind and a calculator showing that your savings should cover your spending. Then comes the uncomfortable question: what happens if you stop working just before investments fall?
That's a cash-flow question you can test. Your stock-bond mix matters, but so do the bills you must pay, the cash you keep available, and the spending you're willing to postpone.
What Sequence of Returns Risk Means
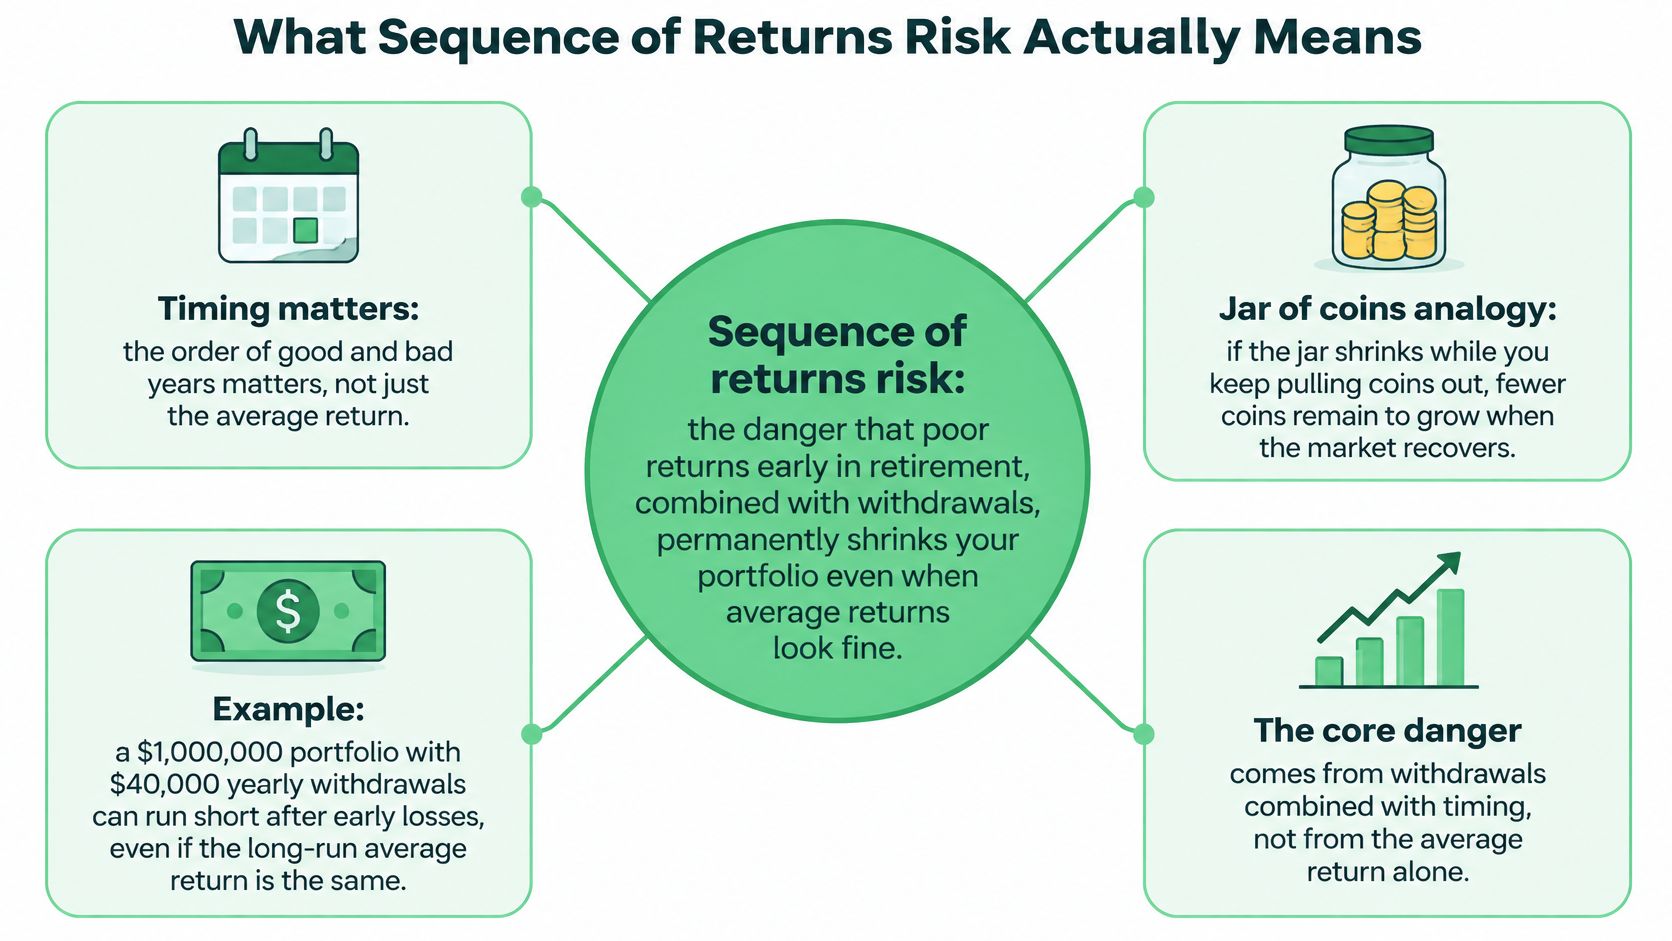
Sequence of returns risk is the effect of investment gains and losses arriving in different orders while you're withdrawing money. An average return hides a key detail: how much remained invested when each return occurred.
For a simple model, treat your investments as shares in a jar. You remove shares to pay expenses. If prices fall, selling enough to raise the same amount of cash takes more shares, leaving fewer to benefit when prices recover.
Once you sell those shares, they're gone from the portfolio. A recovery can raise the value of the shares you still hold, but it cannot replace the ones sold to cover spending. That makes this a cash-flow problem as well as an investment-return problem.
Why average returns can mislead
William Bengen's 1994 study, Determining Withdrawal Rates Using Historical Data, tested retirement start dates across historical periods. For a portfolio with 50% stocks and 50% bonds, it identified a historically worst-case sustainable starting withdrawal rate, known as SAFEMAX, of about 4.15%. The difficult retirement period began in 1966, according to this account of Bengen's SAFEMAX research.
The useful lesson is about how to test a plan. Bengen examined the spending retirees could sustain through the returns they encountered, rather than relying only on a long-term average. A spreadsheet can apply the same logic: list each year's return, subtract planned withdrawals, and track the balance left.
Accumulation means contributing to investments; decumulation means withdrawing from them. After a market decline, contributions can buy more shares at lower prices. Withdrawals during a decline do the opposite: they require selling shares when prices are down.
Practical rule: Test whether your portfolio can support your spending through a difficult return sequence, not just whether its average growth rate looks adequate.
A price decline still matters to savers nearing retirement, especially when there is little time before withdrawals start. For retirees, the pressure rises when investment losses and withdrawals happen together. Flexible spending or cash reserves can reduce the need to sell investments during a downturn, though keeping more cash can also mean holding less in investments.
Same Returns, Different Outcomes in a Worked Example
Consider a hypothetical $1,000,000 portfolio with $50,000 withdrawn at the start of each year, an initial withdrawal rate of 5%. Give it annual returns of +15%, +10%, and -20%, then reverse their order.
Both sequences have an arithmetic average return of approximately 1.67%. The balances below are calculations from those illustrative assumptions, not historical results or forecasts.
Check the opening year by hand. With the bad return first, subtracting the withdrawal leaves $950,000; a 20% decline reduces that to $760,000. With the good return first, the same amount remaining after withdrawal grows 15%, reaching $1,092,500.
Same three returns, two orders, $50,000 withdrawn each year
| Return order | Year 1 end | Year 2 end | Year 3 end | Year 3 end with no withdrawals |
|---|---|---|---|---|
| Good first (+15%, +10%, -20%) | $1,092,500 | $1,146,750 | $877,400 | $1,012,000 |
| Bad first (-20%, +10%, +15%) | $760,000 | $781,000 | $840,650 | $1,012,000 |
Follow the bad-first path through the next withdrawal. You subtract $50,000 from $760,000, then apply the 10% gain to the remaining $710,000, producing $781,000.
By the end, the good-first portfolio holds $36,750 more. Both investors started with the same balance, withdrew the same dollars, and received exactly the same investment returns.
The control that explains the difference
Remove withdrawals entirely and both return orders finish at $1,012,000. Multiplying the starting balance by the same return factors produces the same answer regardless of their order.
Withdrawals change that calculation because you subtract money between returns. A later gain then applies to a different amount of invested capital.
Notice another distinction: an arithmetic average isn't a compound growth rate. Adding annual returns and dividing by the number of years doesn't reproduce what happens to an invested balance. The no-withdrawal result makes that limitation visible too.
The average describes the ingredients. Your cash-flow schedule helps determine the result.
This short example isolates the mechanism. It doesn't estimate anyone's retirement failure probability, account for inflation, or prove that a particular withdrawal rate is safe.
A useful retirement model needs a much longer horizon and many possible return paths. You can reproduce every withdrawal balance above by subtracting the withdrawal from the starting balance, then multiplying what remains by the annual return factor.
How Much Damage the Risk Can Do Historically
Historical results show how strongly spending rules and return timing can shape an account. A retirement model using data from 1926 through 2018 compared constant, inflation-adjusted withdrawals with results from 10,000 simulated scenarios:
| Starting withdrawal rate | Historical sequence failure rate | Monte Carlo failure rate (10,000 scenarios) |
|---|---|---|
| 4% | 0.7% | 2.7% |
| 5% | 18% | 13% |
The gap between starting rates is substantial. Spending a little more at the outset left less room for unfavorable returns, and failures were more frequent at the higher rate in both tests.
A constant, inflation-adjusted withdrawal rises with inflation to preserve purchasing power. It does not reset each year to the same percentage of the remaining balance. That steadier income can help with budgeting, but withdrawals do not automatically fall when the portfolio loses value.
Similar investment performance can produce unequal retirements
A study of retirees around six major U.S. bear markets since 1926 found that groups facing poorer returns while maintaining constant real-dollar withdrawals were 31% more likely to outlive their wealth, received retirement income streams 11% lower, and left bequests 37% smaller than otherwise similar groups with more favorable timing.
One comparison illustrates why cash flows matter. Retirees who began in 1973 and 1974 had similar long-term returns without withdrawals, 5.23% and 5.10%, yet their withdrawal outcomes diverged. The return figures alone do not show what happened to the dollars being taken out along the way.
These group results depend on the periods and assumptions studied. They can show how timing and spending interact, while your own outcome also depends on factors such as asset allocation, retirement length, fees, and how you respond to losses.
You can use an S&P 500 return calculator to explore investment growth across different periods. To model withdrawals, add a cash-flow column to a spreadsheet: subtract each planned withdrawal from the balance, then apply that period's return. Test different return orders and spending adjustments to see how much room your plan leaves for a difficult start.
Historical withdrawal rates are useful inputs for a model, not a promise of success. The higher the starting spending, the less room the plan has to absorb poor returns without changes to withdrawals.
Why Early Retirement Years Carry the Most Risk
Suppose your portfolio falls just as retirement begins. You still need to pay the bills, so you sell investments at lower prices. Even if markets later recover, those gains apply to a smaller balance.
In Morningstar's forward-looking retirement-income analysis, an all-equity portfolio supported an approximately 3.1% fixed, inflation-adjusted starting spending rate at a 90% probability of retaining assets over 30 years. Nearly 70% of simulated failures involved portfolios that had lost value by the end of year five. Among portfolios that avoided losses through those early years, the modeled failure risk by year 15 fell to about 1%.
Those results depend on the study's assumptions. They don't set a universal spending rate, and even a high modeled success probability leaves room for failure. The practical lesson is that the first years of withdrawals can leave little room for a cash-flow plan that never adjusts.
The overlooked risk before your final paycheck
Sequence risk can matter before you retire, too. Academic research on lifetime sequence risk identifies important timing effects near the end of accumulation as well as at the start of withdrawals.
A large portfolio shortly before retirement may be tied to a specific handoff: stop earning, begin drawing from investments, and keep expenses steady. A steep decline can disrupt that plan before the first withdrawal. A glide path, or an allocation schedule that changes as retirement approaches, may reduce some market exposure, but it cannot answer the cash-flow questions: what will you spend, and which assets will cover it?
Write those questions into a simple spreadsheet. Add your planned retirement date, expected spending, and available income, then test what happens if the portfolio drops before or after withdrawals begin. That makes the timing risk visible instead of hiding it inside an average return.
- Retirement date flexibility: Could you keep earning if investments fell shortly before your planned departure?
- Income flexibility: Could part-time income reduce withdrawals from your portfolio?
- Spending flexibility: Which planned expenses could wait without affecting essentials?
More stocks require more tolerance for a bad start
Higher equity exposure can bring larger or more frequent early losses. That trade-off matters when a retirement budget assumes strong growth but leaves little room to cut spending.
Moving toward bonds at a certain age does not resolve every cash-flow issue. Neither does a long investing history guarantee a comfortable transition into withdrawals. Your plan also needs time, income, or liquid reserves that can keep you from selling depressed investments. Test the years just before retirement separately from the years when you are already drawing money.
How to Stress-Test Your Own Withdrawal Path
A spreadsheet can expose a fragile spending plan without pretending to predict markets. Start with a deliberately simple model, then add detail only when you understand what each assumption changes.
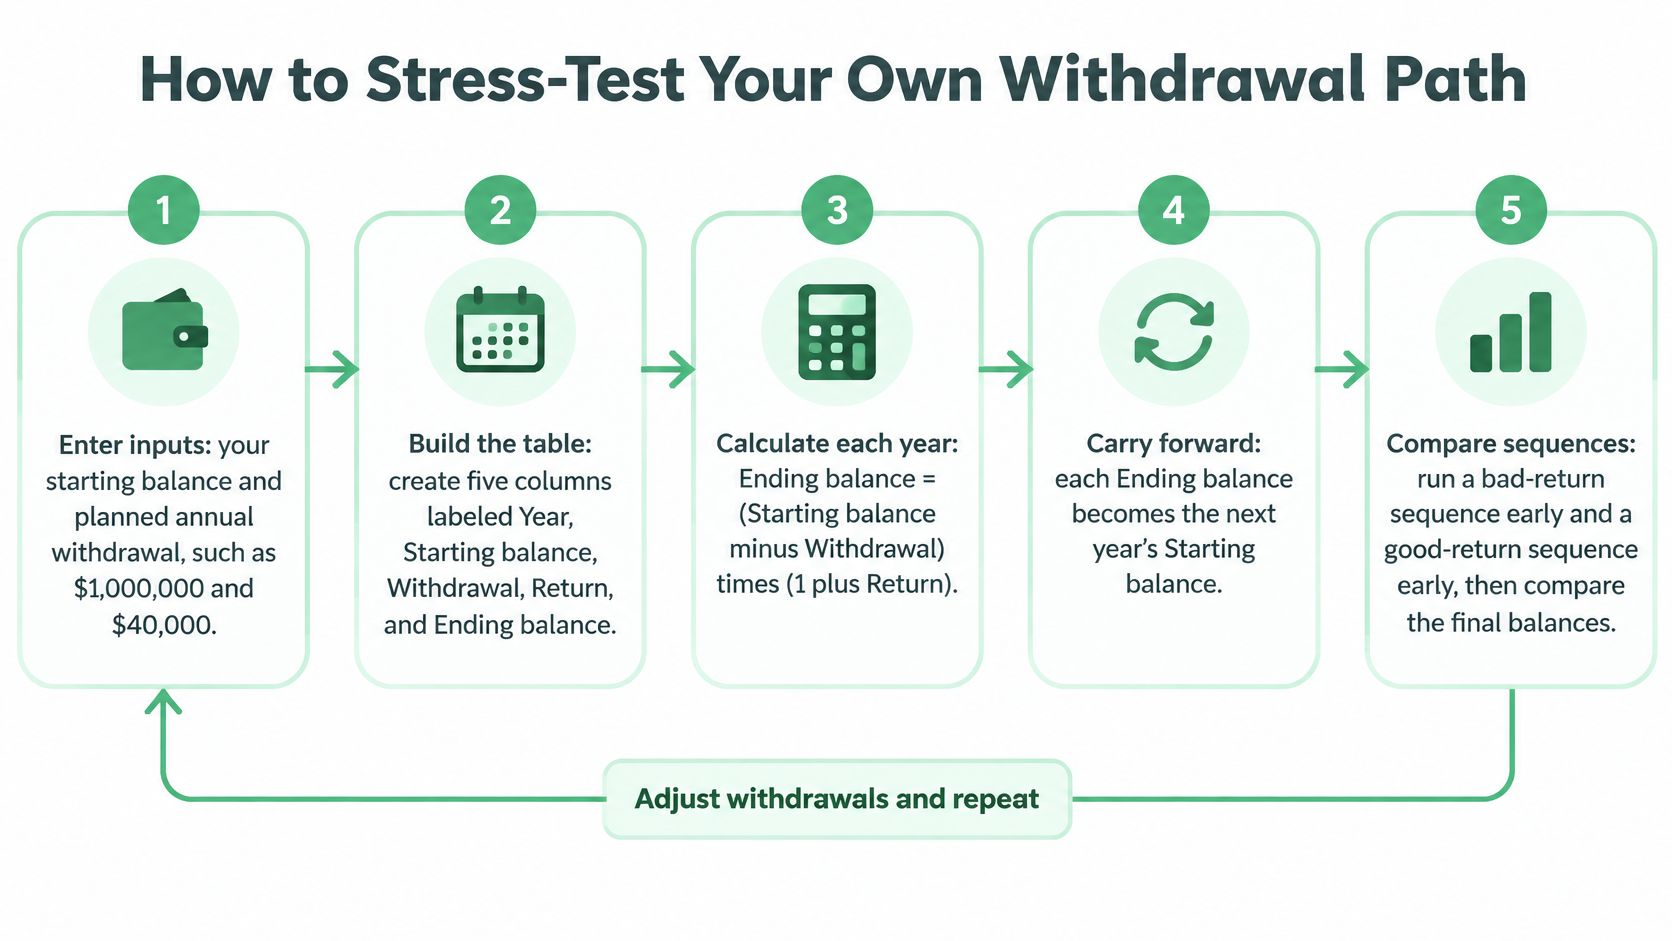
Use this withdraw-first formula:
Ending balance = (Starting balance minus Withdrawal) times (1 plus Return)
That convention matches the worked example. If your actual withdrawals occur throughout the year, a more detailed model can represent that timing, but consistency matters more than false precision.
Build the annual cash-flow model
-
Enter your inputs. Record your starting portfolio balance, planned annual withdrawal, and retirement horizon. Use spending funded by investments rather than your entire household budget if other income covers part of it.
-
Create the columns. Label them Year, Starting balance, Withdrawal, Return, and Ending balance. Keep withdrawals visible rather than burying them inside a growth assumption.
-
Choose illustrative returns. For a practice run, you could use a steady 5% return and compare assumptions from 3% to 7%. These are hypothetical testing inputs, not expected-return estimates.
-
Carry balances forward. Set each starting balance equal to the previous ending balance and apply the formula. Flag the first year when available assets can't fund the planned withdrawal.
-
Run an early loss. Replace the opening return with an illustrative -20%, leaving later assumptions unchanged. Record the ending balance and any depletion year.
-
Test spending flexibility. In a separate version, reduce withdrawals by an illustrative 10% after the decline. Compare both the assets preserved and the spending forgone.
-
Add the pre-retirement test. Apply the same illustrative decline before withdrawals begin, then carry the reduced balance into retirement. Keep this separate so you can see how a late-career loss changes your starting position.
Four stress tests to run on your withdrawal plan
The crash sizes and spending adjustment below are scenario assumptions, not forecasts or recommended universal rules.
| Test | What you change | What it reveals |
|---|---|---|
| Baseline | Steady average return and your planned withdrawal | Whether the plan works on paper |
| Early crash | A 20% drop in year one, then baseline returns | Whether the plan survives a bad start |
| Pre-retirement crash | A 20% drop in the final working year, before withdrawals begin | How exposed a large balance is near its peak |
| Crash with spending cut | Early crash plus a 10% withdrawal cut after the drop | How much flexibility restores the plan |
Keep inflation consistent. Either express returns and spending in inflation-adjusted terms or explicitly increase expenses in a model using nominal returns.
Include fees and portfolio rebalancing when refining the model. A financial independence planning calculation can help establish the savings target you're evaluating, but the withdrawal path needs its own test.
Modeling caution: A scenario shows what happens under its assumptions. It doesn't tell you how likely those assumptions are.
For probabilities, Monte Carlo analysis generates many return sequences. Even then, examine the income path alongside the depletion rate: a plan that survives only through spending cuts you couldn't tolerate isn't a workable plan.
Ways to Blunt the Damage Without Starving Your Budget
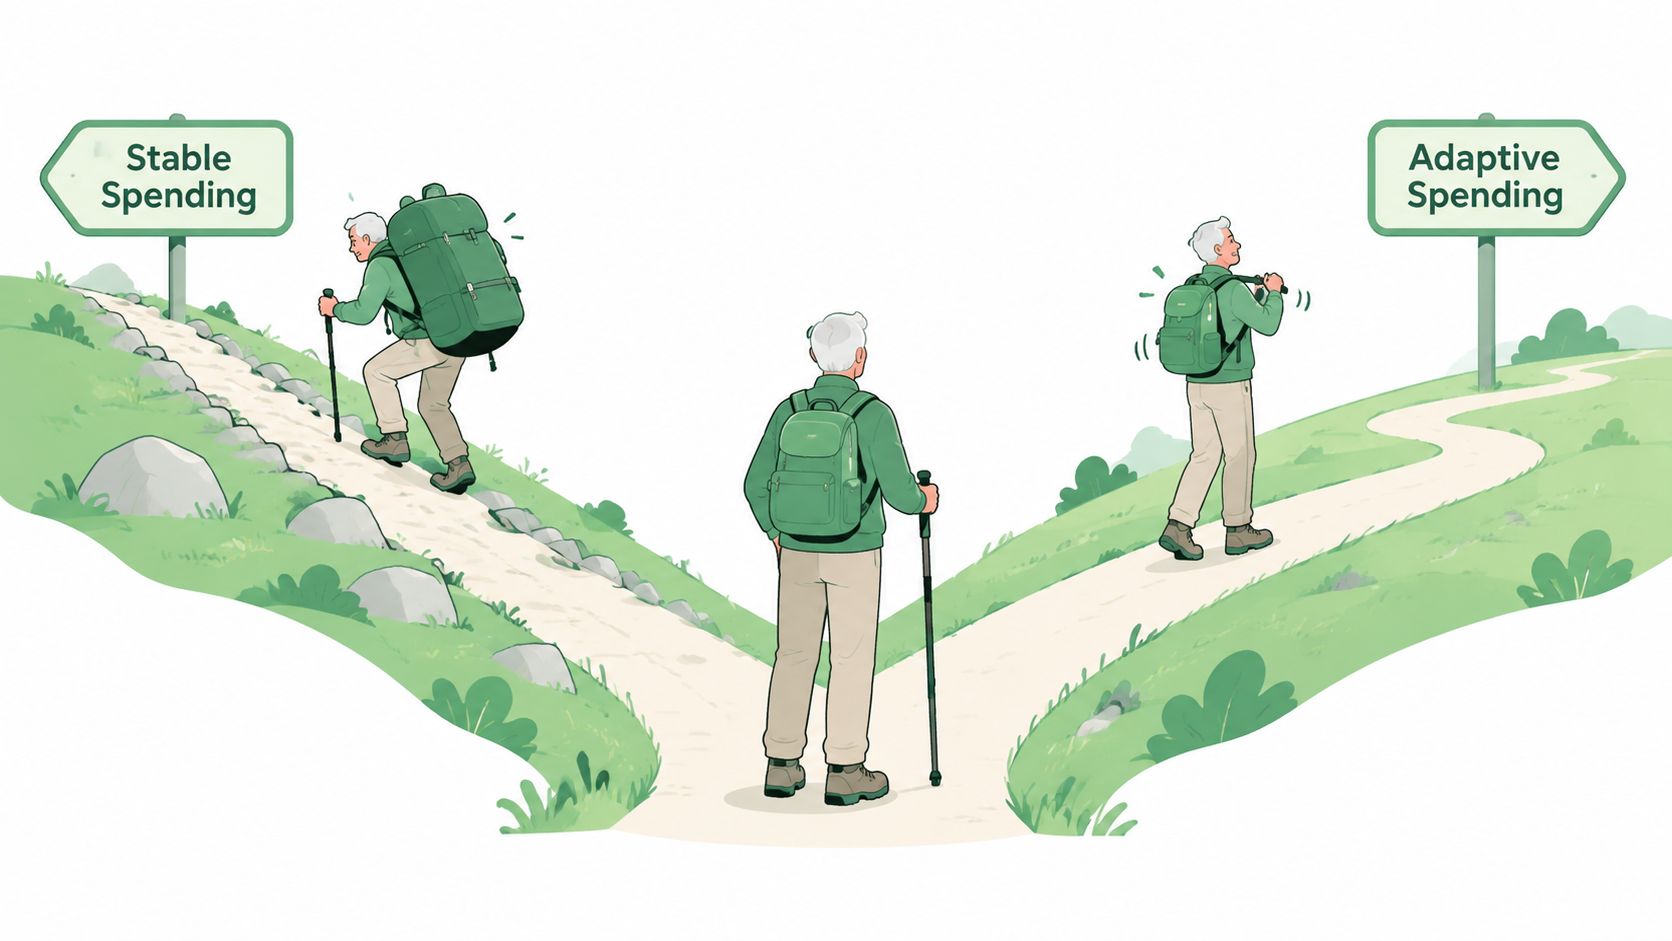
A market decline can force a choice: sell investments to cover bills, or temporarily adjust what you spend. Stable spending and adaptive spending involve different trade-offs. Stable spending keeps your budget predictable, while flexibility can reduce withdrawals when returns are poor.
Spending rules and cash reserves work alongside asset allocation. The practical question is how much flexibility you can use without turning a market decline into a household budget emergency.
Sequence risk defenses and their trade-offs
| Defense | How it reduces forced selling | Trade-off |
|---|---|---|
| Lower starting withdrawal rate | Shrinks the dollars pulled from the portfolio | Less spending from day one |
| Guardrail rule | Cuts withdrawals when the portfolio falls below set thresholds | Requires a spending cut agreed to in advance |
| Cash or short-term bond reserve | Pays bills during a downturn without selling stocks | Lower expected growth on the reserve |
| Skip inflation raises after a down year | Holds dollar withdrawals flat | Purchasing power falls while prices rise |
| Guaranteed income | Covers baseline expenses without depending on portfolio sales | Annuities can involve costs, reduced liquidity, and less inheritance |
Choose flexibility your household can deliver
A guardrail is a spending adjustment you decide on in advance, triggered by a defined portfolio condition. That is more actionable than promising to “spend less if necessary.” Set the trigger and name the expenses you would reduce before a downturn makes the decision stressful.
Then compare the cost of the adjustment with the withdrawals it could prevent. A spending cut may help preserve investments for a recovery, but only if your household can follow through.
Cash also needs a clear operating rule. Decide when to use it, when to replenish it, and what you'll do if the downturn outlasts the reserve. A cash buffer doesn't eliminate investment risk. It gives you another source for bill payments while volatile assets are down. Holding too much cash, however, can leave less of the portfolio invested for long-term growth.
Separate essential bills from postponable purchases
Housing costs and a discretionary trip don't offer the same room to adjust. Someone who can postpone a major purchase has more options than someone with a similar portfolio and less flexible expenses.
Guaranteed income, including Social Security or an appropriate annuity, can cover some baseline expenses without relying on portfolio sales. Fixed-income assets held to maturity can also match available funds to planned spending, though their risks and terms still matter.
Believable flexibility beats an elaborate rule you won't follow. Don't count an expense as adjustable until you've identified what you would cut and discussed it with anyone sharing the budget.
Test each defense against the same market scenarios. Compare the assets remaining, purchasing power lost, and length of any spending reduction. That makes the trade-offs visible in a spreadsheet, rather than leaving the decision to a downturn.
Choose Your Withdrawal Rule Before the Market Does
A 5% starting withdrawal rate, rigid spending, and no cash reserve can leave little room to respond when markets fall early in retirement. Starting nearer 4% or lower may reduce that pressure, while a written adjustment rule gives you a way to change course. A reserve covering one to two years of withdrawals is another option to test, not a guarantee of success.
Each choice has a cost. A lower starting rate means less spending from the outset. Money set aside in a reserve is not invested for growth. Model those trade-offs in a spreadsheet using your own expenses, income, and retirement timeline.
Before settling on a rule, answer three questions:
- Could you make the cut? Test an illustrative 10% withdrawal reduction against actual budget categories. Don't assume every expense can be reduced.
- What covers the essentials? Calculate how much dependable income covers baseline spending, then identify the amount that must come from portfolio withdrawals.
- Does the transition survive? Include a market decline before retirement, not only losses after your final paycheck.
Put the operating details in writing
The 4% rule for retirement offers a starting framework to examine. Your written policy should explain what conditions trigger a spending change, which expenses you would reduce, and when you would review whether spending increases are affordable again.
Give any reserve a defined purpose. Retirement withdrawals and emergency expenses may draw on the same cash, but counting those dollars as fully available for both leaves the plan short.
In our December 30, 2024 newsletter, we recommended keeping emergency funds in high-yield savings accounts or short-term Treasury bills. That recommendation addresses accessible emergency money. Decide separately how large a retirement withdrawal reserve should be and how you will fund it.
Agree on your response while your choices feel manageable, rather than during a decline when every sale feels consequential.
Then run the spreadsheet through different return sequences and spending choices. Record how much you withdraw, which expenses you would trim, and whether dependable income covers the bills you cannot postpone. The rule should be specific enough to follow without reopening the entire plan during a downturn.
Write down your withdrawal rule and the spending cut you would accept before the first bad year arrives. Keep the assumptions visible so you can revisit them as your circumstances change.
Get more posts like this
One short, useful email each Friday. Free, no spam, unsubscribe anytime.