Average Net Worth of Retirees in 2026
Average net worth of retirees in 2026, broken down by age, income, and homeownership with clear guidance on how to use the numbers.

Daniel Anderson
Editor, The Money Maniac
October 19, 2026
11 min read

For U.S. households headed by someone aged 65–74, the average net worth was $1,794,600 in 2022. The median was $409,900. That enormous gap is the story behind the average net worth of retirees: a relatively small number of very wealthy households pull the average far above what's typical (2022 age-group figures from the Federal Reserve's Survey of Consumer Finances).
The median is a better starting point for comparison, but it still doesn't tell you how much money you can spend. A home, retirement account, pension, and Social Security benefit each affect your finances differently. The useful question is how much of your net worth can produce income, and what that income means alongside your housing costs and other dependable resources.
What Retirees Actually Have in 2026
The age-specific figures available for this comparison come from the 2022 Survey of Consumer Finances, the source year for the latest age-group numbers cited here. They aren't measurements of retirees' finances in 2026. The distinction matters: the headline may be framed around 2026, but the underlying benchmark is from 2022.
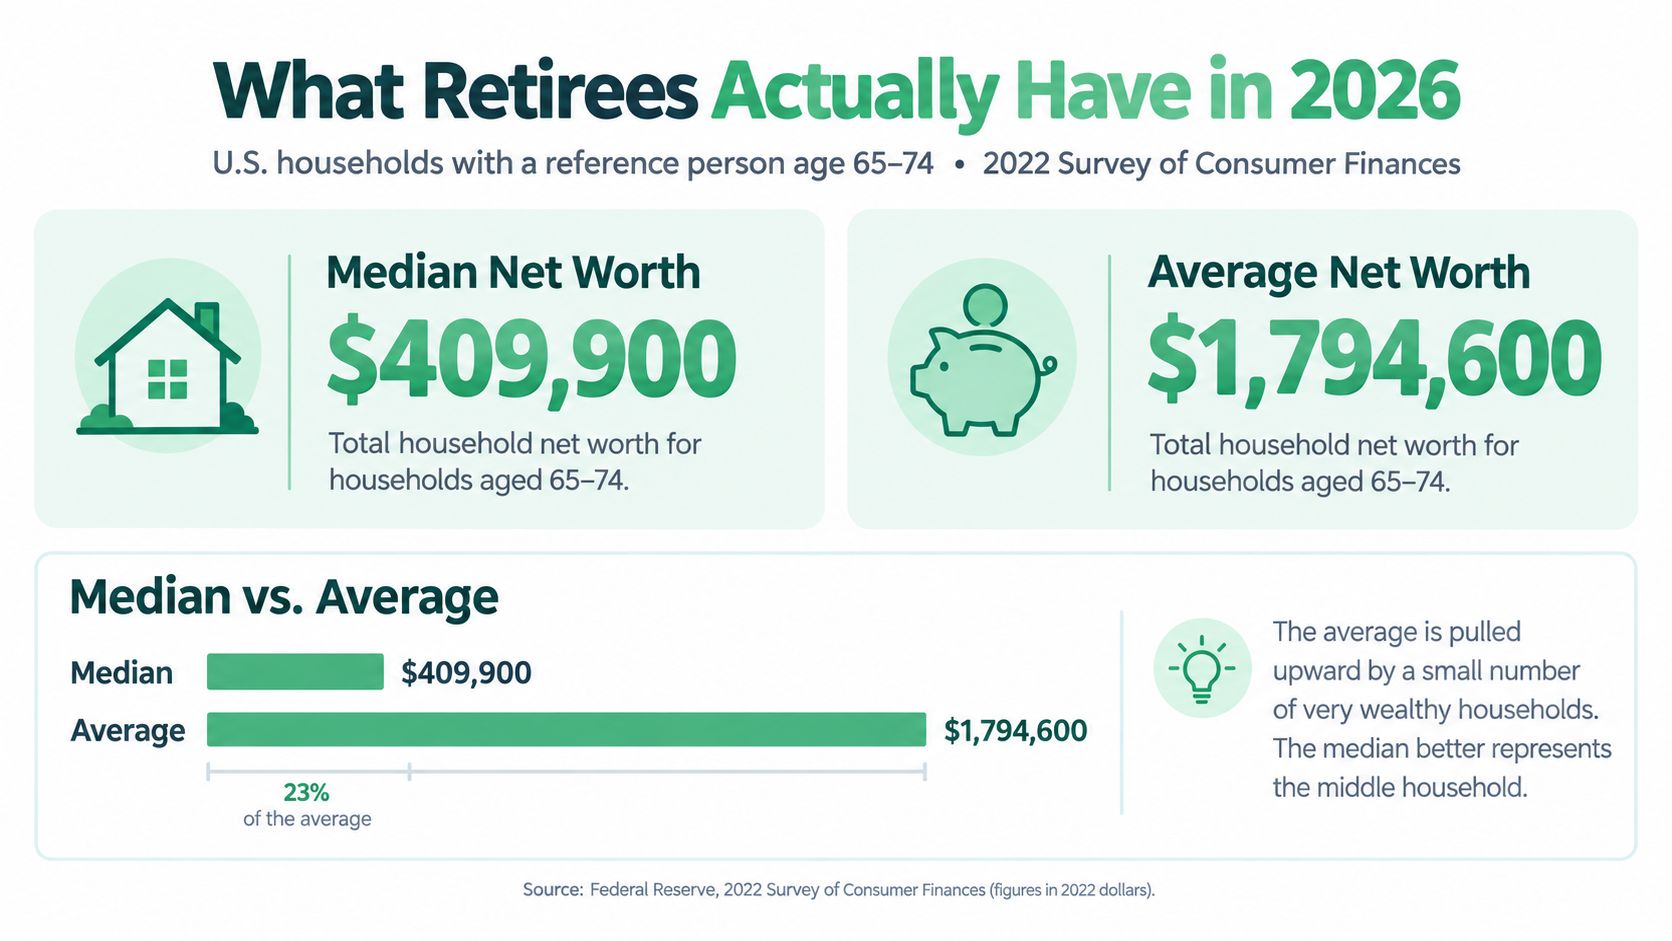
For households headed by someone aged 65–74, the average was more than four times the median. That doesn't mean the typical household in this age group has close to $1.79 million. It means the total wealth of a relatively small number of households pushes the average upward, while the median marks the midpoint: half of households have more net worth and half have less.
Treat these figures as a diagnostic, not a target. They can help you compare your household with an age group, but they can't tell you whether you have enough to support your own retirement. A household with substantial home equity and little invested money faces a different spending reality from one with the same net worth in income-producing assets.
A more useful comparison looks at age, asset type, and income together. The sections that follow break down how the benchmarks change across age groups, what a balance sheet includes, and how a hypothetical household might translate savings and Social Security into an annual-income estimate. The point isn't to chase a national figure. It's to understand what your own balance sheet can do.
Net Worth, Defined and Where the Number Comes From
Net worth is the value of what a household owns minus what it owes. Assets can include a home, retirement accounts, financial investments, and business interests; liabilities can include a mortgage and other debts. A household's net worth therefore isn't the same thing as its retirement savings or the money it can withdraw to pay bills.
That distinction is easy to miss in a headline. A paid-off home can raise net worth substantially, while doing little to pay for groceries unless the owner sells, downsizes, or borrows against it. A retirement account may be more accessible as a source of spending, but withdrawals can have tax consequences depending on the account and household circumstances.
The benchmarks used here are household figures, grouped by the age of the household head. They don't describe each spouse separately, and they don't mean every person in the age band is retired. A working household headed by someone in their late sixties may appear in the same age group as a retired one.
The mean-to-median gap also appears across all U.S. households. In 2022, median household net worth across all ages was $192,900, while average net worth was $1,063,700, another sign that wealth is concentrated (2022 overall household net-worth figures). That's why an average can be mathematically correct yet a poor picture of a typical household.
Practical rule: Before comparing a net-worth number, check whether it's for a person or a household, whether it includes home equity, and whether it's an average or a median.
To get a clean starting point for your own household, list assets and debts consistently. A net worth calculator can help organize the arithmetic, but the result still needs interpretation: total net worth answers what you own net of debt, not what you can comfortably spend each year.
How Net Worth Changes Across Retirement Years
Retiree wealth tends to peak early in retirement rather than at the moment of it. Grouped by the age of the household head, the 2022 Survey of Consumer Finances shows a rise into the 65–74 band, then a decline:
| Age of household head | Median net worth | Average net worth |
|---|---|---|
| 55–64 | $364,500 | $1,566,900 |
| 65–74 | $409,900 | $1,794,600 |
| 75 and older | $335,600 | $1,624,100 |
Source: 2022 Survey of Consumer Finances age-group figures (CNBC Select summary).
The detail worth noticing is that the median falls harder than the average. Between the 65–74 and 75-and-older groups, the mean declines while staying far above a million dollars, but the median gives up a much larger share of its peak. The likely explanation is asymmetric. Wealthy households hold appreciating assets that persist into old age, while a typical household is drawing down savings, adjusting housing, or paying for health care. The average stays high because the households pulling it upward are the last ones to shrink.
That pattern is consistent with a drawdown story, but it cannot prove one. These are snapshots of different cohorts at a single point in time, not the same households tracked over decades. A household headed by someone 75 or older in 2022 lived through different markets than a household headed by someone in their late fifties will, and the bands say nothing about when anyone stopped working or how much guaranteed income arrives each month.
For your own planning, treat the table as orientation. Landing below the median for an age group does not by itself prove a household is behind, because spending needs, housing costs, and income sources vary widely. Landing above it does not prove a chosen lifestyle is sustainable either. The ranking matters less than what the balance can produce each year.
The Four Components of a Retiree Balance Sheet
Two households can report the same net worth and have sharply different financial flexibility. A home, an investment account, and a pension do not pay for groceries in the same way, and for retirees that difference matters more than the total.
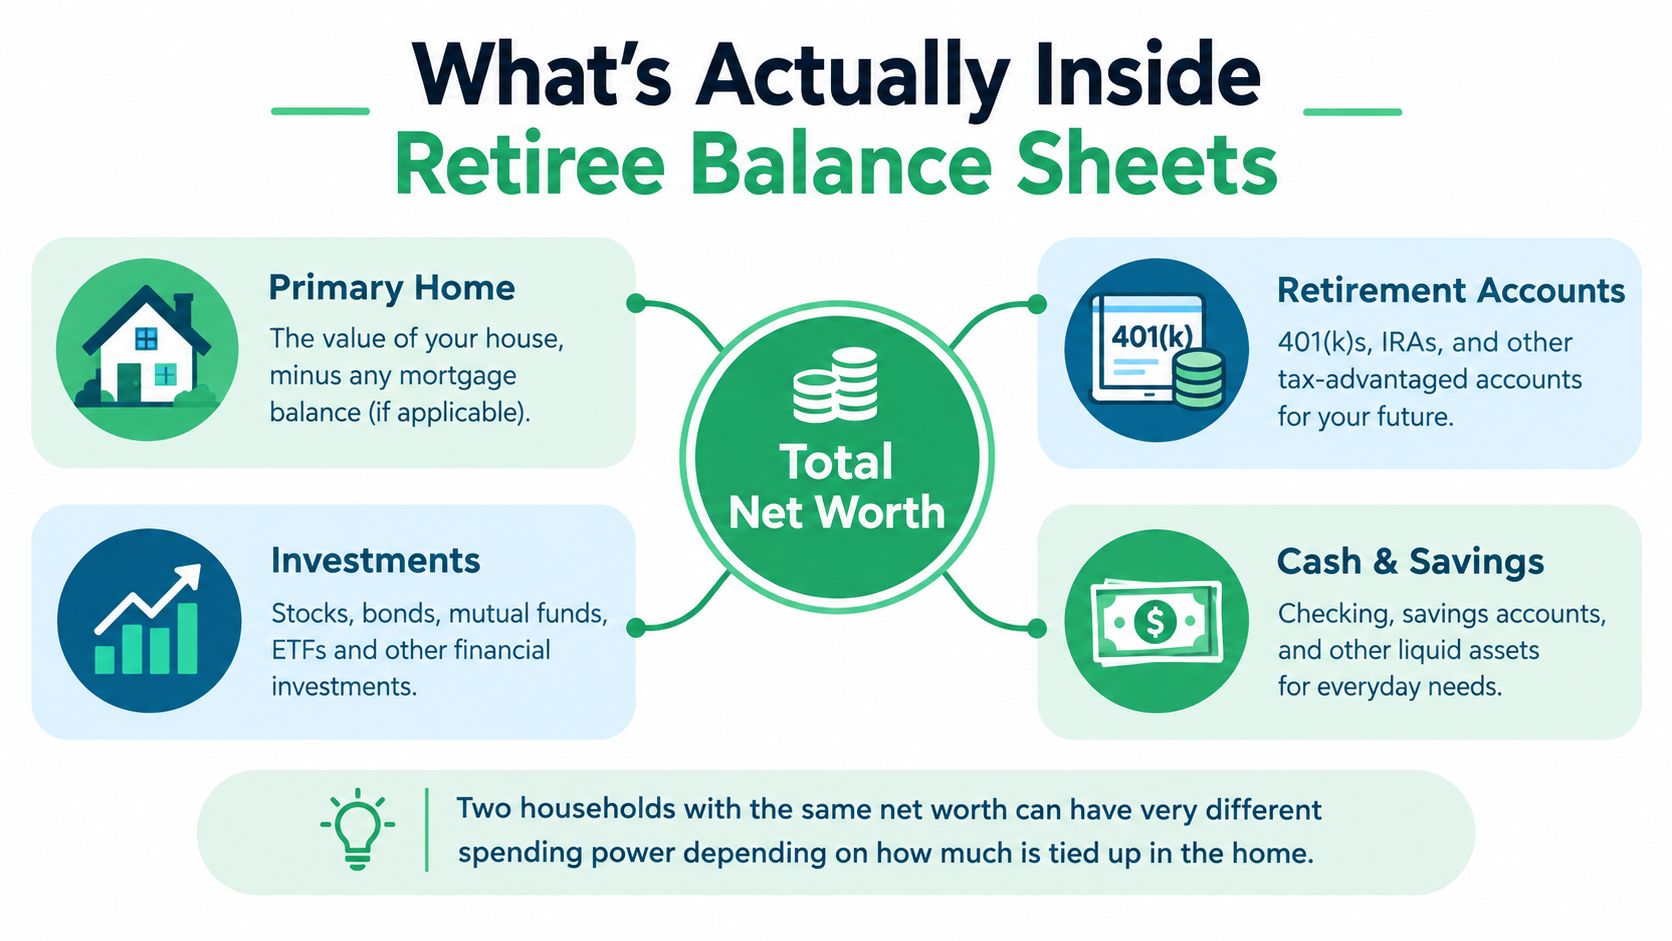
Home equity is the value of a home after subtracting mortgage debt. For households in their late sixties, it typically makes up the largest single share of net worth, which is why the headline total overstates spendable assets. A paid-off home lowers monthly housing costs, but the equity only becomes income through a deliberate decision to sell, downsize, or borrow.
Retirement accounts such as 401(k)s and traditional IRAs fund withdrawals. The statement balance is not after-tax spending money, though. A dollar in a traditional account buys less than a dollar in cash once taxes take their share, so account type shapes how far the balance stretches.
Pensions and Social Security produce recurring income rather than a balance you can draw down. They belong in the income plan, and counting them as another pile of liquid assets distorts the picture. If you are weighing a pension against a lump sum or estimating its worth, this guide to valuing a pension can help frame the question.
Other financial assets (cash, savings, brokerage investments, business interests) vary in how easily they convert to spending. A liquid account pays bills readily. A business stake does not, and selling one may wreck a separate plan.
The same total can describe a paid-off home and modest investments, or a smaller home and a larger portfolio. Those balance sheets do not fund retirement in the same way.
As the age-group table above shows, households headed by someone aged 65–74 reported higher median and average net worth than the 55–64 group in 2022. That larger total says nothing about how much was liquid, invested, or producing income. When you compare your own number, separate the home from the assets you expect to spend.
A Worked Example From Net Worth to Annual Income
Consider a hypothetical couple, both aged 67. They own a home with $250,000 of equity, have $400,000 combined in 401(k) and IRA balances, and hold a small brokerage account. They have no mortgage. This example uses the figures specified for the scenario, but it does not assume a precise value for the brokerage account or a specific pension. Their total net worth is therefore at least $650,000, plus the brokerage account.
The first useful calculation is for the investable portfolio, not total net worth. The couple has $400,000 in retirement accounts, with the brokerage account adding an unspecified amount. Their home equity is part of their net worth, but it isn't included in the portfolio withdrawal calculation unless they plan to sell, downsize, or borrow against the home.

What a 4% illustration does and doesn't say
For a simple illustration, applying a 4% withdrawal rate to the $400,000 in retirement accounts gives $16,000 for the first year. That's arithmetic, not a guarantee of sustainable income. It also leaves out the brokerage balance, taxes, inflation, investment performance, and the risk that either spouse lives longer than expected. The 4% rule explained can provide context, but a rule of thumb can't replace a plan specific to the household.
The couple's Social Security benefits would be added to the portfolio withdrawals, but the example doesn't assign them a dollar amount. Actual benefits depend on each person's record and claiming history, so the sensible next step is to check their current Social Security statements rather than substitute an average for their own estimates.
Pension income, if they have any, would also change the picture. So would taxes: some retirement-account withdrawals may be taxable, and a household's overall income can affect the tax treatment of benefits. Housing costs matter too. With no mortgage, the couple avoids a mortgage payment, but still needs to budget for other costs of owning a home.
The comparison with the age-group median is a prompt to inspect the balance sheet, not a verdict. The couple's total net worth is above the reported median before counting the brokerage account, but that fact alone can't establish whether their income will cover their spending. The practical calculation is: expected Social Security and pension income, plus a cautious portfolio withdrawal, minus taxes and household expenses. That's the number to test against their actual budget.
Why the Median Matters More Than the Average
Use the median as the middle marker, then read the distribution around it. In the SCF age bands, the 65–74 group shows a wide gap between its mean and its median, and the 90th-percentile household sits far above the mean. That ordering matters: a wealthy tail can pull the average upward while the household in the middle stays much closer to the median.
A percentile read gives the sharper benchmark:
| Percentile | What it tells you |
|---|---|
| 25th | Lower edge of the band: often less cushion for shocks |
| 50th | The middle household, useful for location rather than judgment |
| 75th | Upper-middle position, still not necessarily withdrawal-ready |
| 90th | Affluent tail, the group that can drag the mean upward |
The mean is not a ceiling either. A household near the 75th or 90th percentile can look ordinary beside the average because the average is lifted by the largest balances. A household below the median gets even less usable information from the mean, since it describes the whole pool more than the middle case.
The average still earns its keep for aggregate questions: how much wealth an age band holds in total, how exposed older households are to housing and market swings, or how concentrated balances have become. For an individual plan, it answers the wrong question.
Every rank has the same blind spots. Two households at the same percentile can differ in mortgage status, rent, debt, pensions, taxes, and how much wealth is locked inside a home. Percentile position locates you; it does not fund a budget.
Place your household in the age band, estimate the nearest percentile, then test whether accessible assets plus reliable income can cover spending under bad markets and a long life.
Your Personal Benchmark and Savings Target
A useful retirement benchmark starts with the assets you can realistically use, not just the total on a net-worth statement. Run through this checklist before changing your savings plan:
-
Separate investable net worth. Exclude your primary home unless selling it, downsizing, or borrowing against it is part of your plan. Keep home equity visible, but don't assume it can pay monthly bills as-is.
-
Compare with the median for your age group. Use it as context, not a pass-or-fail line. Check whether your household has similar debts, housing costs, and sources of reliable income.
-
Set a target from the income you need. Start with expected annual spending, then account for dependable income and the amount your investments may need to provide. If you're building a savings target from a household goal, this savings target calculator guide can help organize the calculation.
-
Stress-test the plan. Ask how it holds up if inflation raises expenses, investments fall, or you or your spouse live longer than expected. A plan that works only under friendly assumptions needs another look.
For a household roughly 10 to 15 years from retirement, an income-multiple savings target can be a starting framework, but no single multiple is right for everyone. Spending needs, Social Security, pensions, taxes, and housing plans all affect the amount required. Choose a target by working backward from the retirement income you need, then revisit the assumptions as your circumstances change.
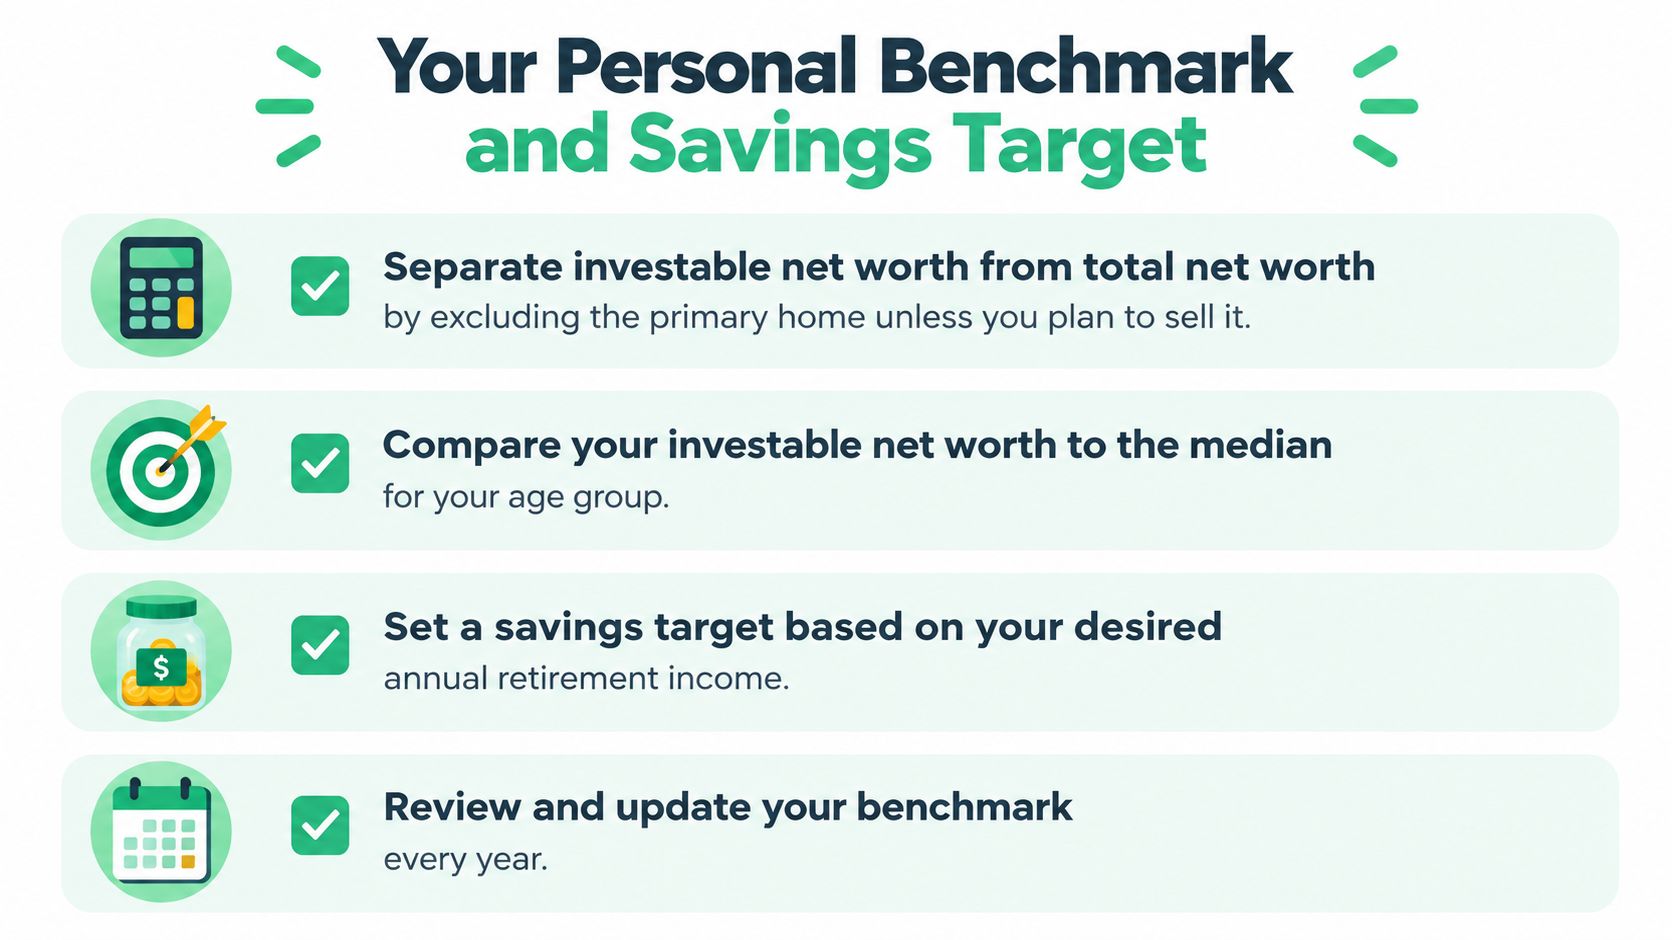
Review the balance sheet annually and after major changes, such as a housing move, retirement, or a shift in household income. A benchmark only helps when it reflects the household you have, not the one a headline assumes.
What These Numbers Mean for Your Next Decision
For households headed by someone aged 65–74, the median of $409,900 is a more useful comparison point than the $1,794,600 average. Both figures describe total household net worth in 2022, not money available for annual spending. The average is heavily affected by the wealth held by a relatively small number of households.
Your next decision should come from your own balance sheet. Pull your current Social Security statement, list investable assets separately from home equity, and compare your position with the median for your age group. Then check whether expected income and withdrawals can cover your spending before changing your savings rate.
Get more posts like this
One short, useful email each Friday. Free, no spam, unsubscribe anytime.