What Is a Good Monthly Retirement Income in 2026
What is a good monthly retirement income? Use 2026 spending near $5,083 a month, then build your number from bills, Social Security, and withdrawals.

Daniel Anderson
Editor, The Money Maniac
November 22, 2026
15 min read

Mandatory pensions in OECD countries replace an average of 63.2% of net wages for a full-career worker on average pay, yet the same systems replace under 35% in Australia, Ireland, and Lithuania and more than 85% in several European setups, according to Pensions at a Glance 2025. That spread is the whole argument. A good monthly retirement income is a personal range, built from what your household spends after guaranteed checks, not one national dollar figure you can copy from a neighbor.
If you own the house, the range usually sits lower than a renter's. If you still carry a mortgage, help adult kids, or live where insurance and property taxes bite, it sits higher. Average spending also tends to ease after 75, even while a bad medical year can blow a hole in a budget that looked fine in January.
The rest of this is the worksheet I'd walk a friend through at the kitchen table. Plain numbers, a clear opinion, and no promise that the market will behave.
A Good Monthly Retirement Income in Plain Numbers
A good monthly retirement income is enough to pay a real household's bills and still leave a cushion. The best public snapshot of those bills is about $5,083 a month. Investopedia's write-up of the latest federal spending figures puts 2025 spending by U.S. retired households headed by someone 65 or older at about $61,000.
That number is a receipt, not a required paycheck. A paid-off house in a modest area can land under it. Rent, a leftover mortgage, or a high-cost city can land well above it. Treat the average as a fence post you walk past, then measure your own lot.
What the 2025 bills actually looked like
Age already splits the average. Households headed by someone 65 to 74 spent about $62,900. Households headed by someone 75 or older spent about $54,500. Later life often costs less in total, even though healthcare can get scarier. One flat target for age 66 and age 82 will overstate the quiet years and understate the busy ones.
| Household or cost | Annual amount | Monthly equivalent | How to read it |
|---|---|---|---|
| Retired household, head age 65 or older | $61,000 | $5,083 | National spending snapshot for 2025, not a target |
| Head of household ages 65 to 74 | $62,900 | $5,242 | Higher-spending years of retirement |
| Head of household age 75 or older | $54,500 | $4,542 | Total spending often falls later |
| Housing share of the $61,000 average | $23,180 | about $1,930 | 38 percent of spending, so rent or a mortgage moves the whole budget |
| Healthcare in the same average | $7,938 | $662 | Premiums and care in a typical year, not a long-term-care shock |
Housing was 38% of that $61,000 average, near $1,930 a month. Healthcare in the same average was $7,938 a year, about $662 a month. Those two lines explain why two neighbors with the same Social Security check can feel rich or broke.
Practical rule: If the house is paid off, start your budget under the national average and add back only the costs you still have. If you rent or still owe the bank, start above it.
Why one national band still helps
From that 2025 snapshot, a working national band is about $4,500 to $5,300 a month. The lower end lines up with households 75 and older. The upper end lines up with the 65 to 74 group, a little above the overall $5,083 average. Use the band to see whether your first draft is in the same zip code as other retired households. Then throw the average out.
Your good income is the bills you will write checks for, plus a cushion you can name. The pages below replace $5,083 with your housing, your premiums, your taxes, and the checks that already show up without selling an investment.
Replacement Rates and the Social Security Floor
A replacement rate is the share of pre-retirement pay that all retirement income covers together. Social Security, a pension, and withdrawals from savings sit in the same bucket. A practical U.S. screen for a moderate earner is 70% to 80% of pre-retirement income. The Social Security Administration's retirement benefit booklet is the right place to see why the public check does not replace the same share for everyone.
At full retirement age, benefits replace about 79% of earnings for a very low earner, about 43% for a medium earner, and about 28% for a maximum earner. The formula is progressive on purpose. Lower earners get a larger slice of prior pay. Higher earners get a larger check in dollars and a smaller slice of the lifestyle they were funding from a paycheck.
The $60,000 walk-through
Say you earned $60,000 a year before you stopped. An 80% target is $48,000 a year, or $4,000 a month, from every source combined. If Social Security supplies $2,000 a month, the other $2,000 has to come from a pension, withdrawals, or similar income. The portfolio is not being asked to replace the whole salary. It is being asked to cover the hole.
Claiming before full retirement age lowers the monthly benefit and widens that hole. Delaying raises the benefit and shrinks the savings you need for the same lifestyle. The calendar choice is a savings choice. Our guide on when to take Social Security walks through the trade if you are still staring at the claiming form.
Where the shortcut fails
I would use 70% to 80% as a first screen while you are still working and the bills are fuzzy. I would not defend it once you can list the checks. It is too rich for someone whose mortgage is gone and whose travel is a long weekend, not a second home. It is too thin for someone still paying rent, carrying a home equity balance, or sending money to family every month.
Once the bills are known, prefer a spending target over a percentage of gross pay. Gross pay included commuting, retirement contributions, and a work wardrobe you may not miss. It did not include the property tax bill that keeps arriving in October.
Seventy to eighty percent is a flashlight, not the floor plan. Turn it off when you can see the rooms.
How to Calculate a Personal Monthly Target
Run one sequence and stop hunting for a magic monthly number. You are solving for a gap, then asking savings to fund only that gap.
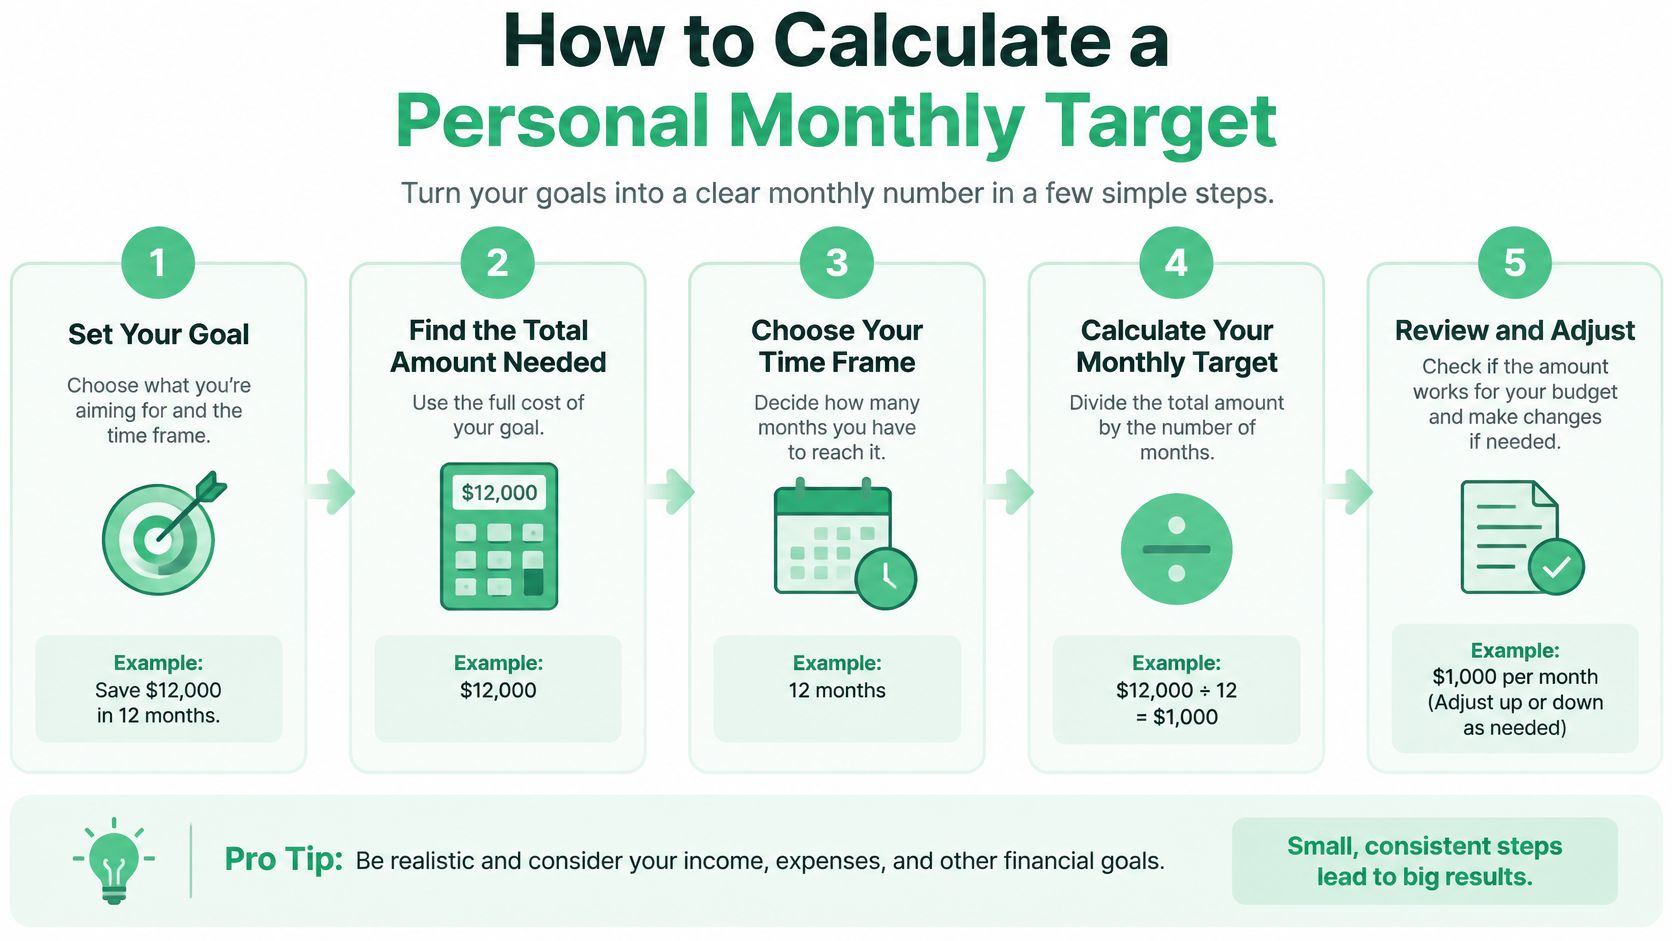
- Write a year of spending in four buckets. Housing is the mortgage or rent, taxes, insurance, and upkeep. Healthcare is premiums, prescriptions, and the out-of-pocket costs you already know. Everyday living is food, utilities, transportation, and the ordinary life you want to keep. Taxes plus irregular bills covers income tax and the car, the roof, or the furnace that does not care about your monthly average.
- Divide by 12. That yearly total is your monthly lifestyle target. Do this before you look at the portfolio. A target built from investments backward is how people talk themselves into a lifestyle the bills will not support.
- Subtract guaranteed income. Take off Social Security and any pension you can already name. What remains is the gap. Annuity income you have already bought belongs here too, as a fixed check, not as a product pitch.
- Fund only the gap from savings. Everything else is already covered. Selling investments to replace a check you already receive is how a solid plan gets nervous for no reason.
The 2025 starting rate for the gap
For the portfolio piece, Morningstar's 2025 retirement spending analysis uses a base case of about 3.7% of the starting portfolio in year one, with later withdrawals adjusted for inflation. The case aims at a 30-year retirement, a 90% chance of money still being there, and a mix with roughly 20% to 50% in stocks.
In words, monthly portfolio income is portfolio value times 0.037, divided by 12. $1,000,000 supports about $37,000 a year, or $3,083 a month, before taxes and fees. $500,000 supports about $1,542 a month on the same assumptions.
Date that 3.7% as a 2025 research estimate. Valuations and inflation assumptions move. Recheck Morningstar, or rerun the math with a current planner, before you treat it as this year's number. A longer retirement, higher fees, or a demand for more certainty calls for a lower rate. Someone who will cut spending after a bad market can start higher and live with a less steady lifestyle. That trade is real. Pretending you will cut when you have never cut is not a plan.
Pulling too much in the first bad market creates sequence-of-returns trouble. You sell shares while prices are down, so fewer shares are left when prices recover. The percentage is a guardrail against that, not a yield the market owes you.
Four methods, four blind spots
| Method | What you get | Use it when | Main blind spot |
|---|---|---|---|
| Expenses-first budget | The monthly bills you actually need | You can list housing, healthcare, living costs, and taxes | Ignores a bad market early in retirement |
| 70 to 80 percent replacement | A quick screen off pre-retirement pay | You are still working and want a first pass | Salary is not the same as spending |
| 3.7 percent starting withdrawal | Portfolio income for about 30 years in Morningstar's 2025 base case | Savings have to fill the gap after guaranteed income | Not guaranteed; fees, longevity, and inflation can force a lower rate |
| Pension or annuity modeling | Part of the gap turned into a fixed monthly check | You want income that does not depend on selling investments | Can be hard to undo, and inflation protection and fees change the real check |
Use the budget to set the target, the percentage screen only while you are still guessing, and the 3.7% math only on the gap. A pension or annuity model belongs in the guaranteed line if you want a check that does not require a sale. Read the inflation rider and the fee before you fall in love with the monthly figure. None of this names a fund or an insurer, because the math does not need one.
Healthcare Shocks That Break an Average Budget
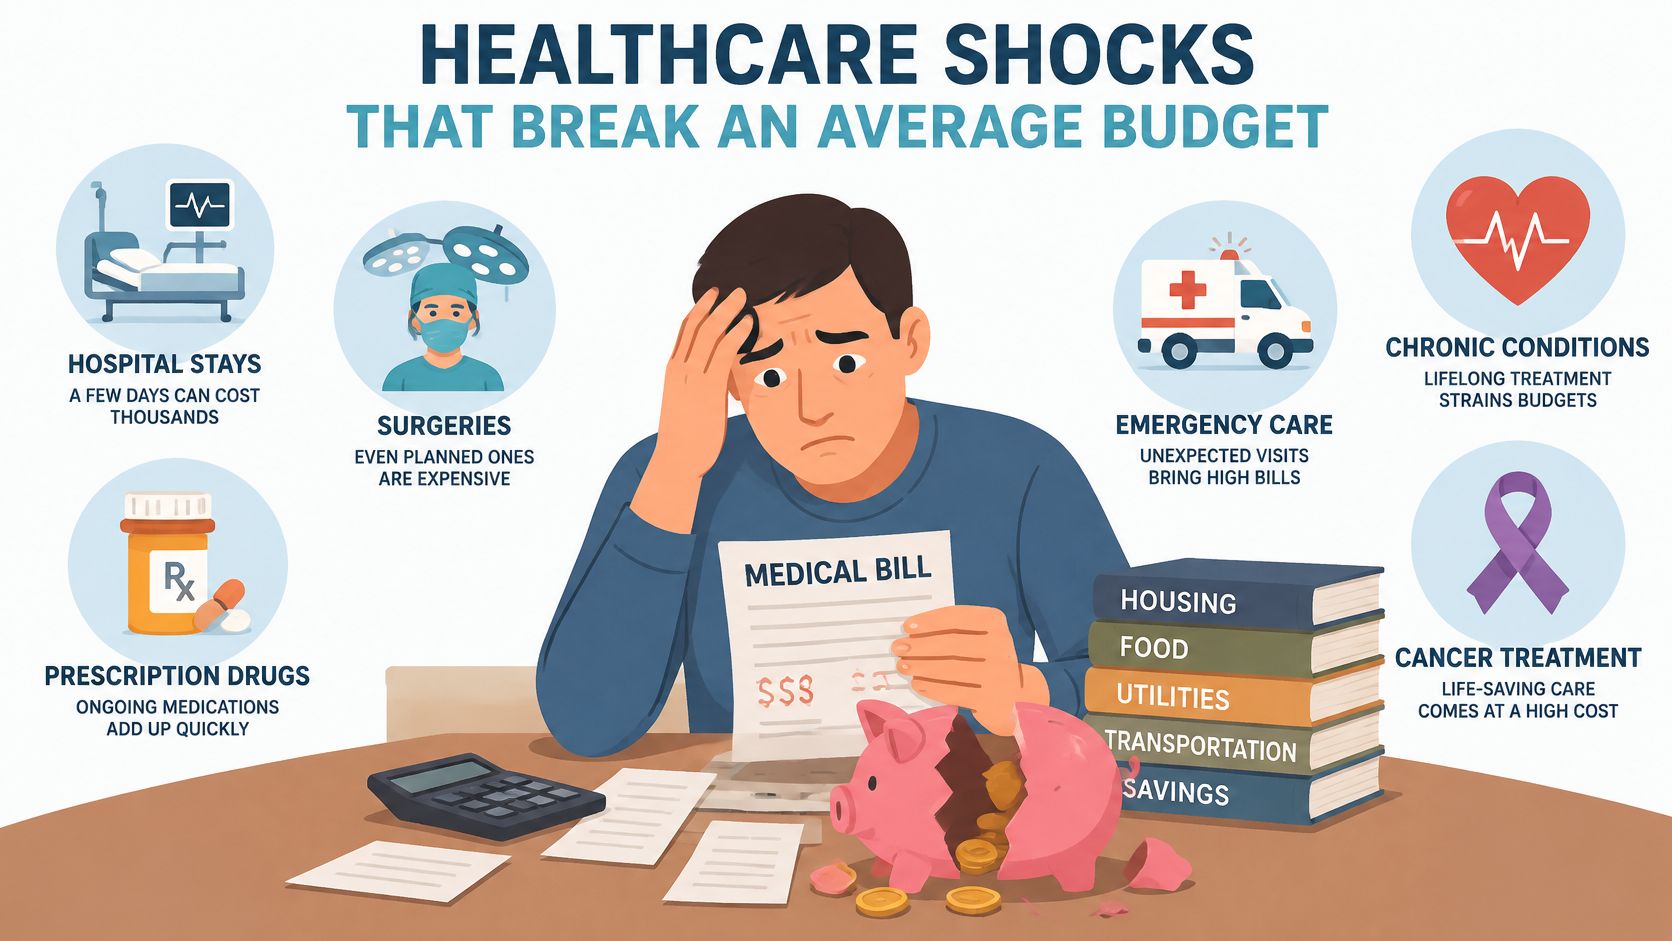
A normal month is the wrong test of a good income. Schroders' U.S. retirement survey on living in retirement found that retirees devote an average of 16% of monthly income to healthcare, counting premiums, prescriptions, and out-of-pocket costs. In the same research, 58% expected Medicare to cover a larger share than it does. That gap between expectation and the bill is where comfortable budgets go to complain.
A separate 2026 survey in that same reporting found that 49% of retirees have higher expenses than they expected, and that more than half do not know how long their savings will last. If you only fund the month that looks like last March, you are planning for the month that already happened.
Two layers, then a cash buffer
Split the target into two layers.
- Ordinary budget: Housing, food, the premium you can name, utilities, and the taxes that show up every year.
- Shock allowance: A medical year, a roof, a stretch of inflation, or a few months when the market is a poor time to sell.
Keep one to two years of healthcare and repair money in cash or short-term Treasuries. The point is boring. A down market should not be the week you are forced to sell shares to pay a surgeon or a roofer. Yields on those holdings change, so check the current rate when you buy. Today's yield is a price tag, not a permanent fact.
Housing, food, and insurance tend to rise with prices. A pension that stays flat does not. If your guaranteed check has no cost-of-living adjustment, the shock layer has to grow even when this year's premium looks fine. Medicare is also not a full long-term-care plan. A resilient target sits above a comfortable one for that reason alone.
If you retire before Medicare starts, price coverage for those gap years on purpose. Our notes on health insurance for early retirement are the U.S. version of that homework. Readers who also support family living in Spain can compare family policies in Spain so a parent's premium is a line in the budget, not a surprise wire.
Many retirees underspend because they are afraid of running out. A good number has to last, and it also has to be safe enough to use.
Add the shock line before you decide the portfolio withdrawal is sufficient. If the ordinary bills fit and the shock line does not, you do not have a good income yet. You have a fair-weather one.
A Worked Example With Real 2026 Numbers
Take one medium earner and stay with that household. The Social Security Administration's 2026 replacement-rate illustrations say a worker with $70,000 of career-average earnings who retires at full retirement age 67 replaces about 41% of that pay. The benefit in the illustration is roughly $28,700 a year, or $2,392 a month, before deductions.
Set the comfortable lifestyle at 75% of $70,000. That is $52,500 a year, or $4,375 a month. It sits inside the 70% to 80% screen, and it is a choice, not a law. Subtract the benefit. The gap is $23,800 a year, or $1,983 a month. At the 3.7% starting rate from the 2025 research case, the portfolio that fills the gap is about $643,000.
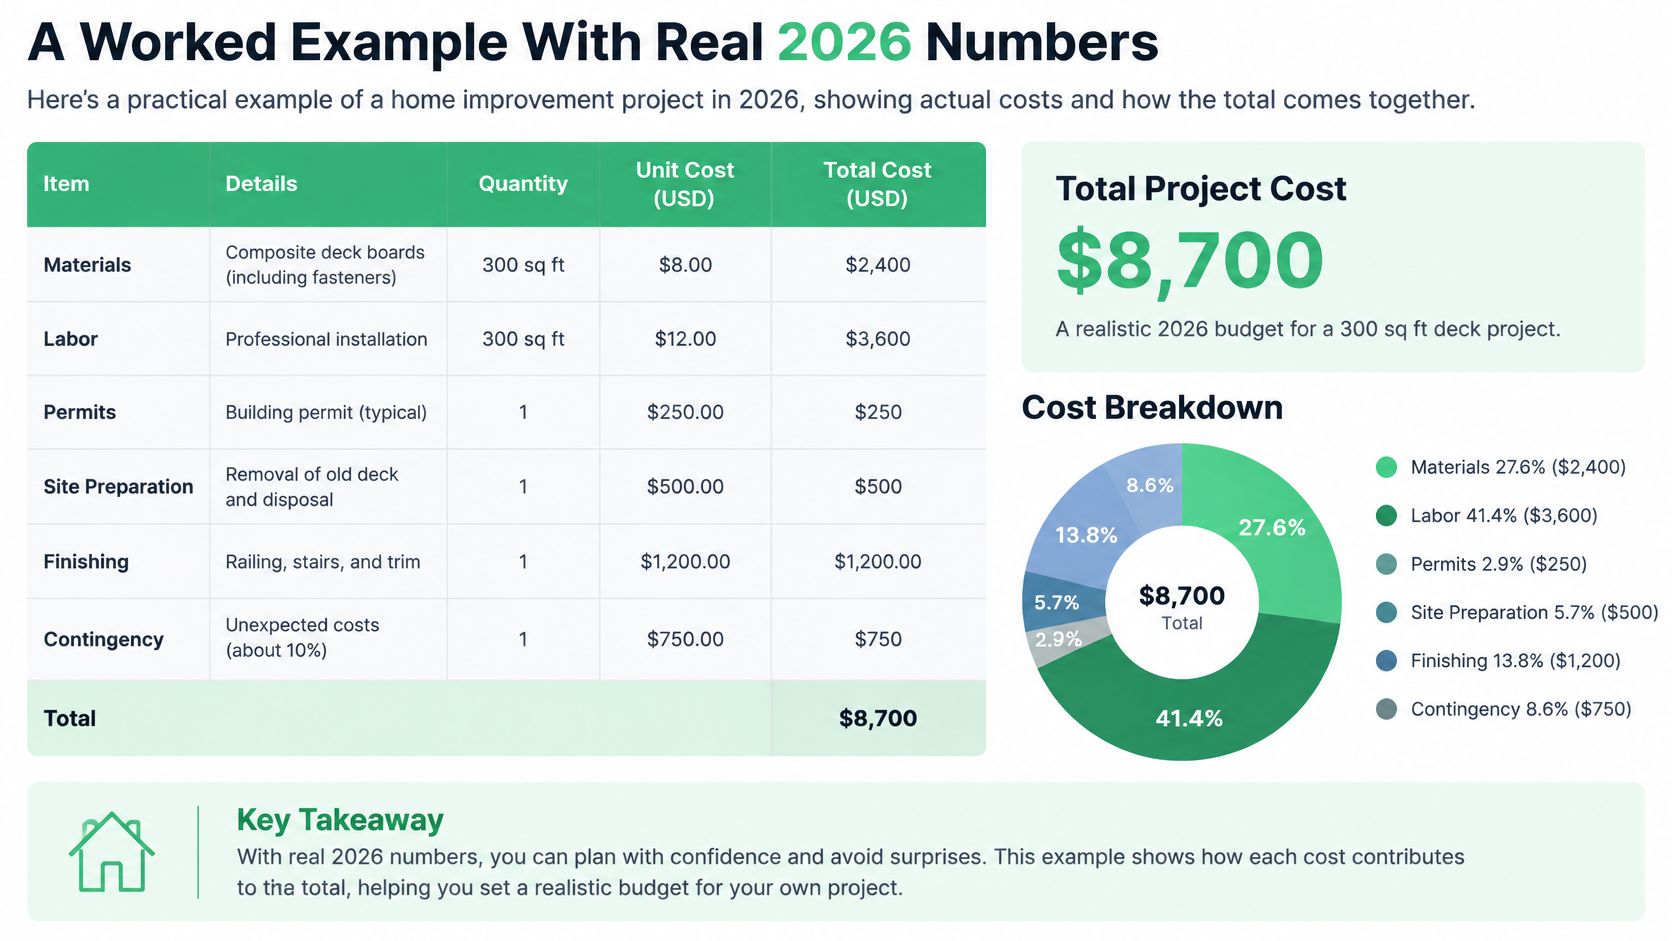
| Line | Annual | Source or assumption |
|---|---|---|
| Career-average earnings | $70,000 | Starting pay for the illustration |
| Social Security at full retirement age 67 | $28,700 | 2026 SSA illustration, about 41 percent replacement, before deductions |
| Comfortable target at 75 percent of pay | $52,500 | Chosen lifestyle, inside the 70 to 80 percent screen |
| Gap to fund from savings | $23,800 | Target minus Social Security |
| Portfolio that fills the gap at 3.7 percent | about $643,000 | 2025 Morningstar base case, not a guarantee |
If savings are $500,000 instead
The same 3.7% rate on $500,000 produces about $1,542 a month. Add the $2,392 benefit and total income is about $3,934 a month, close to 67% of prior pay. That can still be a good income when the house is paid off and healthcare stays near a typical $662 month. It is a poor one if rent or a medical year shows up and there is no shock cash behind it.
If you use a different starting rate
Test the same $23,800 gap before you lock the plan.
- A more cautious 3.0% needs about $793,000. Use this if retirement may run past 30 years, fees are high, or you want a thicker margin.
- The older 4% rule of thumb needs about $595,000. People still quote 4%. Label it as a historical shortcut, not the 2025 base case. Check the current research rate before you use it.
A worker with maximum taxable earnings, in that same 2026 illustration, has a benefit that replaces only about 27% of career-average pay. The public check is still useful. It covers a much smaller share of a high lifestyle, so the same 75% target needs a much larger portfolio. Build the number from the three pieces you can see, the benefit, any other guaranteed check, and the withdrawal, and skip any fund, insurer, or product name. The illustration does not need one.
What Pushes Your Target Up or Down
The national band is a starting fence. These are the levers that move your own number, in the order they usually matter.
Age, then the house
Total spending often drops after 75, while healthcare becomes a larger worry inside a smaller budget. A single monthly target for the whole retirement overstates late life and understates the early years, when travel and house projects still feel urgent. Budget the first decade a bit richer, and do not assume the lower later years will pay for a nursing home. They often just mean fewer cars, fewer trips, and a quieter grocery cart.
Housing is the other big swing, because it was such a large share of average retired spending. A paid-off home can make about $4,000 a month feel comfortable. A mortgage or big-city rent can make $6,000 feel tight. Household size moves the gap faster than small cuts. One Social Security check versus two changes the math more than skipping restaurants. Two modest benefits can close a hole that one larger benefit leaves open.
Taxes and the bills that are not monthly
Withdrawals from traditional retirement accounts are not all spendable. Part of the gross withdrawal pays the tax bill, so the amount you sell has to be larger than the bill it is meant to cover. Roth money you already paid tax on does not have that haircut. If you mix the two, plan the gross sale, not the net hope.
Irregular costs belong on a yearly list, not inside the grocery budget. A car, a roof, or help for family will wreck a monthly average if you pretend they are optional until they arrive. Put a yearly number on the sheet and divide by 12 so the "surprise" is already funded.
For inflation, run an illustration, not a forecast. Raise the essential budget 3% a year for five years on a scratch pad and see whether Social Security and any pension keep up. If the pension is flat, the gap widens even when your habits do not. Recheck the illustration when you update the budget. A planning bump is not a prediction of next year's CPI.
Three labels you can copy
Write these on the sheet and pick one on purpose.
- Minimum covers housing, food, healthcare, and taxes. If income falls to this line, the lights stay on and the prescriptions get filled.
- Comfortable adds the life you want. Trips, gifts, hobbies, and the restaurants you would miss.
- Resilient still covers both after a market drop or a medical year, because the shock cash and a lower withdrawal are already in the plan.
Pick the resilient number if you cannot cut spending without real pain. Pick the comfortable number only if you can trim and you have practiced trimming. Hoping you will become flexible at 78 is not the same as being flexible now.
Set Your Monthly Target and Fund the Gap
Write one number this week. Comfortable monthly spending, minus Social Security and any pension. Multiply that monthly gap by 12, then divide by 0.037. The result is the portfolio that matches the 2025 research case, not a promised return. If you want the historical 4% shortcut beside it, our explainer on what the 4 percent rule is for retirement shows where that rule came from and where it bends.
If savings fall short, use the levers in this order. Trim discretionary spending first, because it changes the gap tonight. Reconsider the claiming age next, because a larger benefit shrinks the portfolio you need. Work a few more years if health and the job allow it. Accept a lower withdrawal and a leaner lifestyle only after those are honest choices, not after you have ignored them.
The same asset math shows up in our guide on how to calculate a FIRE number. Daniel Anderson's own fat FIRE goal is a personal lens, not a forecast for you. He keeps working, saving, and investing until a 3% to 4% withdrawal could produce a very high income. For this household, use that 3% to 4% band only as a planning range. Recheck today's portfolio yields before you treat any percentage as income you can spend. Our Compound Interest Calculator is there if extra monthly saving might still close the gap before work stops. You can see how a lump sum and a monthly contribution compound, then decide whether the extra years are worth it.
The free Friday newsletter, read by more than 20,000 people, is where we keep practicing the same earning, budgeting, and investing decisions without naming a fund, an insurer, or a product to buy.
Get more posts like this
One short, useful email each Friday. Free, no spam, unsubscribe anytime.