Upper Middle Class Net Worth: What It Actually Looks Like
Learn what upper middle class net worth means in 2026. See real numbers by age, where money lives, and a simple plan to reach that financial level.

Daniel Anderson
Editor, The Money Maniac
October 8, 2026
11 min read

In 2022, an upper-middle-class household in the United States could reasonably be placed between $553,100 and $1,559,240 in net worth, the Federal Reserve's 75th-to-90th-percentile range. The median household had $162,350, so “upper middle class” describes a distributional position, not one magic dollar target.
That range sounds precise until you ask better questions. How old is the household? Is most of its wealth tied up in a house, or held in liquid investments? Does it live in a high-cost city, own its home outright, or rent with a diversified portfolio? A household with $600,000 may be affluent compared with the typical household while remaining nowhere near the $11.64 million threshold associated with the top 1%.
The useful answer, then, isn't just “save this amount.” It's to measure total net worth, age-adjusted position, accessible wealth, and housing equity separately. That approach removes some of the noise from social comparison, which is often a financial planning tool with the subtlety of a casino billboard.
What Upper Middle Class Net Worth Actually Means
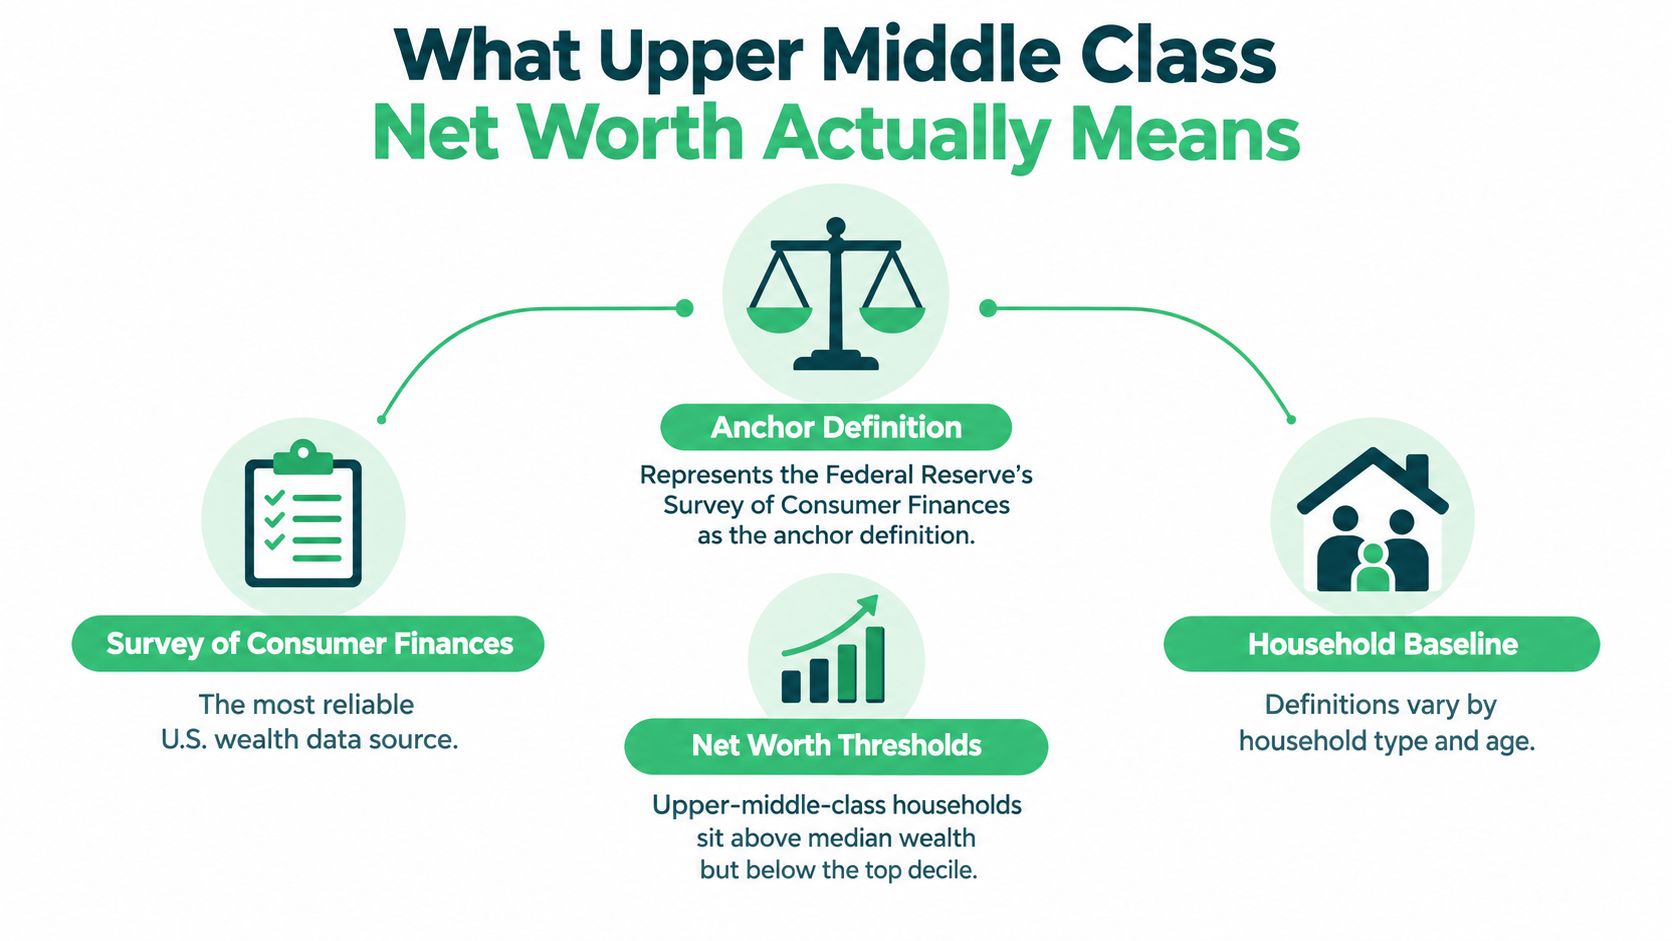
The 2022 Survey of Consumer Finances places the practical upper-middle-class range between the 75th and 90th percentiles of household net worth. Those benchmarks are $553,100 and $1,559,240, stated in 2022 dollars, while the median household held $162,350. The Federal Reserve does not publish an official definition of “upper middle class,” so this range is an analytical guide, not a universal classification. (Federal Reserve wealth benchmarks)
That range becomes more useful when applied to real households. One household may have $600,000, mostly in home equity and retirement savings. Another may have $1.4 million while supporting several dependents, carrying a large mortgage, and paying high housing and education costs. Both may sit within the same broad wealth bracket, yet their cash flow, flexibility, and ability to absorb a setback can differ sharply.
A range, not a lifestyle guarantee
The broader distribution shows why a percentile label should not become a lifestyle promise. Household net worth rises from $20,856 at the 25th percentile to $11.64 million at the threshold for the top 1%. Upper-middle-class wealth can provide meaningful protection and choice, but it does not buy the same flexibility as top-tier wealth.
A $600,000 household may be wealthy relative to the median and still have limited accessible money. Selling a home, accepting retirement-account penalties, liquidating a business, or selling investments during a market decline can turn headline net worth into a costly source of cash. A $1.4 million household may have more room, but a large mortgage and high recurring expenses can absorb much of that advantage.
The number also changes meaning with household composition, age, homeownership, debt, and geography. Use the benchmark to locate your household in the distribution. Then assess whether your reserves, accessible assets, and spending needs provide genuine security.
Practical rule: Use the Federal Reserve range as a reference point, then judge your position through four measures: total net worth, age-adjusted position, accessible wealth, and housing equity.
How the Federal Reserve Measures Household Wealth
The Federal Reserve measures household wealth through a balance sheet: assets minus liabilities. Its household balance-sheet data includes a household's primary residence, other real estate, bank deposits, retirement accounts, brokerage investments, business interests, and vehicles. Liabilities include mortgages, credit-card balances, student loans, auto loans, and other debts.
A practical household balance sheet should record both the total and the category behind it. Suppose a household owns:
- A home worth $900,000
- Retirement and brokerage accounts worth $450,000
- Cash worth $50,000
Its total assets equal $1.4 million. If the mortgage and other debts total $500,000, net worth is $900,000, not $1.4 million. Log that result in a tracker as $400,000 of home equity, $450,000 of investments, and $50,000 of cash. The breakdown exposes the household's housing concentration immediately.
Why the subtraction matters
An expensive residence can raise net worth without creating much monthly breathing room. Property taxes, maintenance, insurance, and mortgage payments still require income or cash reserves. Home equity may be valuable but difficult to spend, so a household can look strong on paper while having limited funds for an emergency or sudden loss of income.
Debt repayment improves the balance sheet even when investment values remain unchanged. Paying down a $20,000 loan balance raises net worth by $20,000, assuming asset values do not move. That gain comes from reducing liabilities, not from earning an investment return. The Federal Reserve's balance-sheet framework treats the change accordingly.
The percentile groups behind the headline
The Federal Reserve's Distributional Financial Accounts divide families into the bottom 50%, the 50th-to-90th percentiles, the 90th-to-99th percentiles, and the top 1%. The top 1% is split further between the top 0.1% and the remaining 0.9%. The series provides quarterly household-wealth estimates beginning in the third quarter of 1989 and tracks both total wealth and its composition. (Federal Reserve Distributional Financial Accounts)
The 50th-to-90th-percentile group offers a useful reference for upper-middle-class analysis because it covers households above the median and below the richest 10%. It also shows why a single benchmark can hide meaningful differences. Housing, corporate equities, business assets, pensions, and debt affect financial flexibility in different ways.
Use two layers when reviewing your own position. The first is total net worth. The second identifies where the total lives, how much is accessible, and whether it could support an emergency, career change, or earlier retirement decision.
Why One Net Worth Number Can Mislead
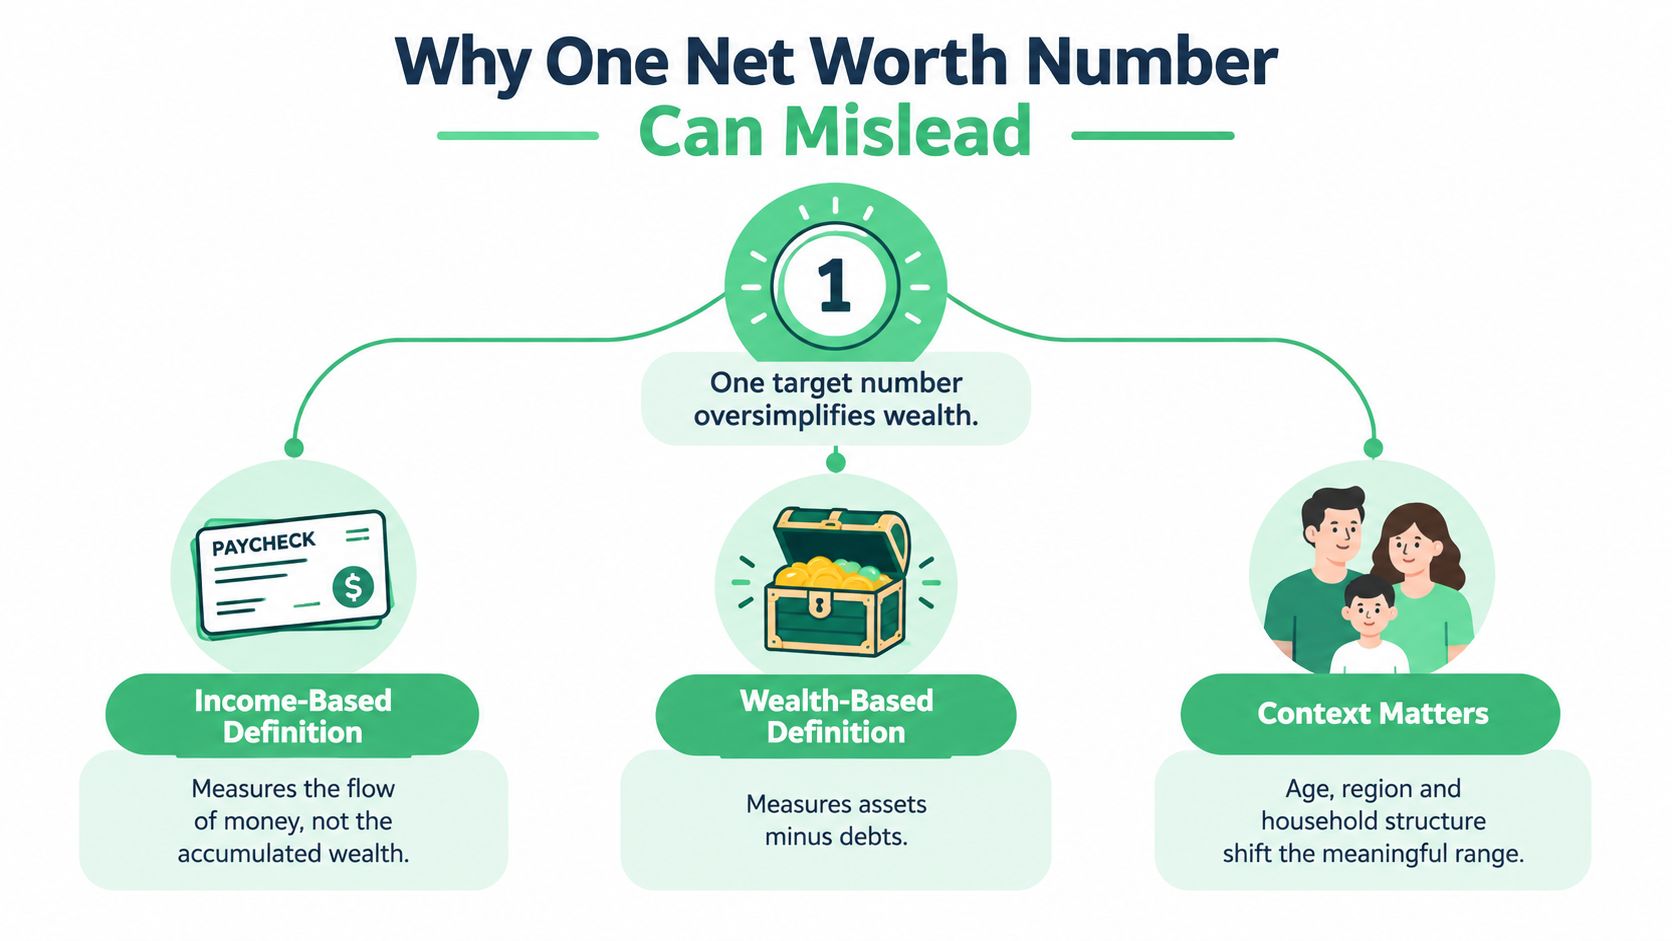
Income and wealth answer different questions. Income is a flow, the money arriving over a period. Net worth is a stock, the assets accumulated after subtracting debts. Confusing them creates bad comparisons.
A high-earning professional may have substantial student debt, a large mortgage, and little invested wealth. A lower-income retiree may own a debt-free home and hold significant financial assets. An income label can describe current earning power, while a wealth figure says more about accumulated resources. Neither one, by itself, tells the full story of financial security.
Age changes the comparison
Net worth usually has more time to accumulate later in life, so comparing a young adult with a household nearing retirement can create unnecessary panic or false comfort. The approximate U.S. net-worth threshold for the top 10% ranges from $372,120 for adults under 35 to nearly $3 million for those aged 55–64. (Age and income bracket wealth analysis)
That spread doesn't mean younger households should ignore wealth building. It means the relevant question is often, “Am I progressing for my stage of life?” rather than, “Have I reached an older household's balance sheet?”
Four measures that tell a better story
Track these measures separately:
- Net-worth percentile: Where your total assets minus debts sit in the overall distribution.
- Age-adjusted percentile: How that position compares with households at a similar life stage.
- Liquid or investable net worth: Cash and financial assets that can generally be accessed without selling a residence or disrupting a business.
- Debt-adjusted housing equity: Home value minus mortgage and related debt, considered separately from financial investments.
A household with identical total net worth can have very different resilience depending on whether its assets are diversified or concentrated in one residence. That distinction is especially important for entrepreneurs and early-career professionals whose income can be high but uneven.
An interactive calculator can make this framework practical by separating total wealth from accessible wealth and testing emergency-fund coverage, debt service, and retirement readiness. The output should guide decisions, not assign a personality type based on a number.
How to Calculate Your Actual Net Worth
You can calculate net worth with a spreadsheet, a piece of paper, or a calculator. The method is simple, but accuracy depends on listing everything rather than counting only the accounts you enjoy looking at.
Step one, list the assets
Use current, reasonable values for:
- Cash: Checking, savings, and other bank deposits.
- Investments: Brokerage accounts, retirement accounts, and other financial holdings.
- Property: Primary residence and other real estate.
- Business interests: A cautious estimate of what an ownership stake could reasonably be worth.
- Personal property: Vehicles and other meaningful assets, using realistic resale values.
For a home, estimate market value and subtract the outstanding mortgage. A practical home equity valuation guide can help you avoid treating the original purchase price as the current equity figure.
Step two, list every liability
Include mortgages, credit-card balances, student loans, auto loans, personal loans, and other debts. Then subtract total liabilities from total assets. If you want a clearer picture, maintain separate totals for home equity, investments, cash, business assets, and debt rather than relying on one grand number.
For a worked balance sheet, the net worth calculator can help organize the same asset-minus-liability calculation. The useful output isn't a flattering score. It's a list showing which balance-sheet category needs attention.
Step three, update it consistently
Quarterly tracking is usually enough for household planning. Don't obsess over every market movement. Instead, watch whether debt is falling, savings are rising, cash reserves remain appropriate, and housing is becoming an ever-larger share of the total.
A $20,000 debt reduction raises net worth by $20,000 if asset values don't change. That doesn't mean debt payoff is always superior to investing, because interest rates, tax treatment, liquidity, and risk all matter. It does mean balance-sheet progress can come from more than chasing investment gains.
Where Upper Middle Class Wealth Actually Lives
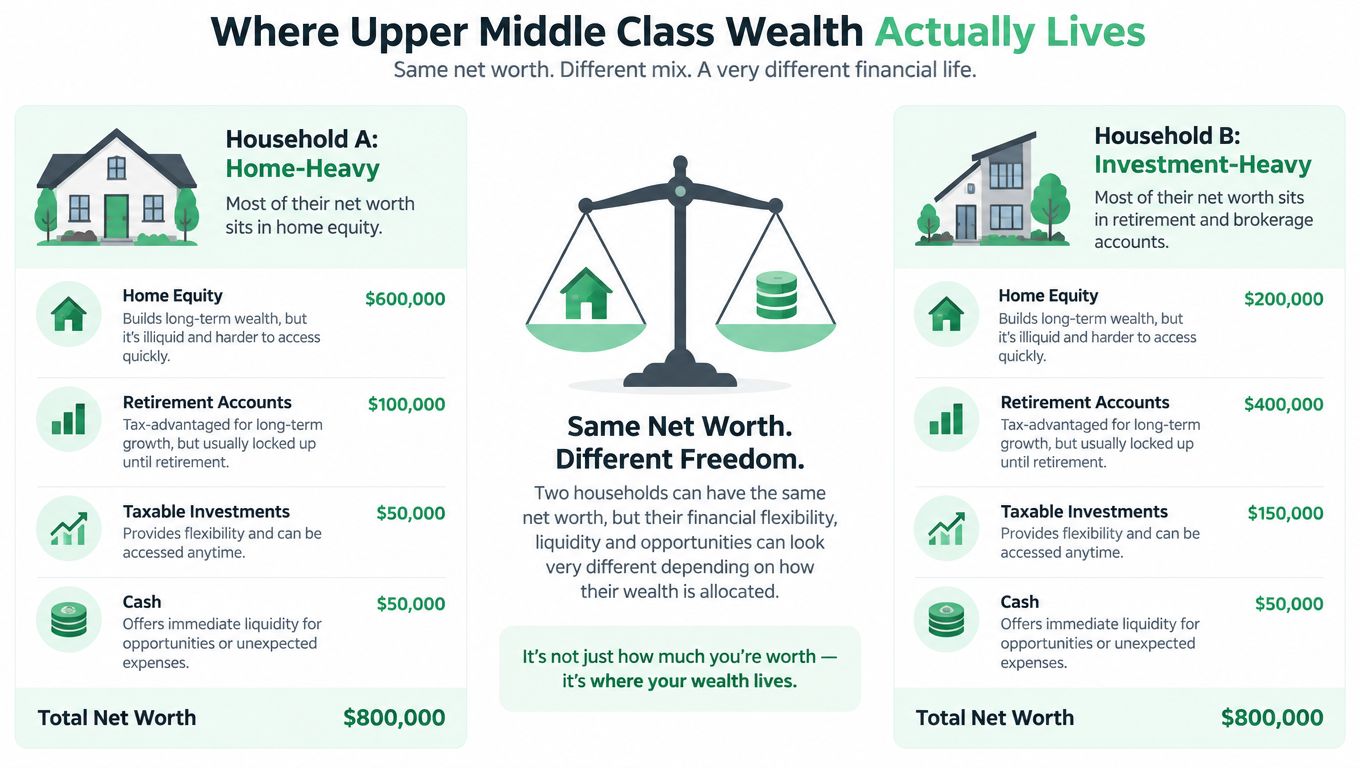
Two households can each report $1 million in net worth and have very different financial choices. Household A has $800,000 in a primary residence and $200,000 in retirement accounts. Household B has $500,000 in home equity, $450,000 in diversified investments, and $50,000 in cash. The Federal Reserve Survey of Consumer Finances asset data helps frame why the asset mix matters, not just the total.
Household A owns substantial wealth, but most of it is tied to the home. A job loss or early retirement could require borrowing, selling, moving, or drawing down a relatively small financial portfolio. Household B still relies partly on housing, yet its larger investment and cash balances create more options without putting the residence on the market.
The trade-off behind each asset
The Federal Reserve separates asset ownership rates from the median or mean value among households that own each asset. That distinction matters because households build similar totals through different routes. A business owner, homeowner, and renter with financial investments may reach comparable net worth while facing very different liquidity, risk, and spending constraints.
Home equity can provide stability and reduce future housing costs, but it concentrates wealth and is difficult to access quickly. Retirement accounts can support long-term goals, while access rules and market volatility limit their flexibility. Taxable investments are generally easier to use, and cash provides resilience, though both may support less long-term growth than assets held for retirement.
Market prices can change financial wealth without any new saving or borrowing. The Federal Reserve reported that financial assets fell sharply in real terms during 2022 before recovering some losses in early 2023. A household's net worth can therefore shift materially even when its behavior remains unchanged.
The better question is not “How large is the pile?” It's “How much of the pile can solve the next problem without creating a worse one?”
Geography adds another layer. You can browse top wealthy towns, but visible affluence reveals little about liquidity, asset concentration, or household debt. Wealth has a location, and that location affects how much freedom the balance sheet can actually provide.
Geography, Housing, and the Comfort Question
A dollar of net worth doesn't buy the same lifestyle everywhere. Housing costs, mortgage structures, taxes, healthcare, education, retirement systems, and public benefits all shape what remains after the balance sheet is calculated.
OECD research finds that homeowners hold nearly 95% of national wealth on average across OECD countries. The same research discusses house prices rising by around 6% annually during the period examined and describes how higher interest rates since 2021 increased borrowing costs and may exclude younger and lower-wealth buyers. (OECD household wealth and housing research)

Three ways the same wealth can feel different
An owner-occupier may have strong home equity and predictable housing once the mortgage is reduced, but face maintenance costs, taxes, and limited mobility. A mortgage holder may have rising equity alongside a demanding monthly payment. A renter may have less housing equity but more financial assets and the freedom to relocate.
Home appreciation can raise nominal net worth without improving financial flexibility. A homeowner may be unable to access that value cheaply, may not want to sell, and may face a concentrated local market. A renter with globally diversified investments can have a lower balance-sheet total but more money available for emergencies or a career move.
Housing decisions should therefore be judged by their full cost, not by appreciation alone. Include mortgage payments, insurance, taxes, maintenance, commuting, and the opportunity cost of the money tied to the property. The question is practical: What net worth supports the life you want in your city and housing situation?
For readers weighing the broader housing problem, why homes are so expensive offers useful context. The answer won't be identical for a renter, a homeowner with substantial equity, and a buyer carrying a large mortgage.
A Practical Plan to Reach Upper Middle Class Net Worth
Use the four-measure framework as a dashboard rather than a finish line. First, calculate total net worth and place it against the Federal Reserve distribution. Then adjust the interpretation for age, identify liquid assets, and separate housing equity from the rest.
Find the weakest measure
A household may have a respectable total but weak liquidity. Another may have strong investment balances but expensive debt. A third may have growing home equity while retirement savings remain thin. Fix the weakest link before optimizing a category that already looks healthy.
A practical checklist:
- Protect liquidity: Keep enough accessible cash for the emergencies your income and household structure make plausible.
- Control expensive debt: Compare the guaranteed benefit of reducing interest costs with the flexibility you would lose by using available cash.
- Diversify the balance sheet: Avoid allowing one home, business, employer, or investment category to dominate your financial future.
- Build long-term assets: Use retirement and taxable investment accounts in a way that matches your time horizon and tolerance for market losses.
- Review housing with objectivity: Treat home equity as valuable, but don't count all of it as spendable wealth.
The right monthly investment amount depends on income, debt, cash reserves, goals, and risk. A structured guide to how much you should invest each month can help turn a vague intention into a number you can sustain.
The strongest plan makes steady progress across several measures. A household with less headline wealth but manageable debt, accessible savings, and diversified investments may be in a better position than a household with a larger total trapped in one expensive property. Compare less, measure more, and update the plan when your income, household, or housing situation changes.
Get more posts like this
One short, useful email each Friday. Free, no spam, unsubscribe anytime.