50/30/20 Budget Spreadsheet: How to Build and Use It
Build a 50/30/20 budget spreadsheet that actually works. Get formulas, a downloadable template, examples, and customizations for any income.

Daniel Anderson
Editor, The Money Maniac
September 17, 2026
10 min read
Payday arrives, the bills leave, and the money that remains seems to develop its own escape plan. You check your account, guess what you can spend, then discover that groceries, subscriptions, debt payments, and one aggressively expensive takeout habit have all been competing for the same dollars.
A 50/30/20 budget spreadsheet gives those dollars jobs before they disappear. Built properly, it uses after-tax income, calculates spending ceilings automatically, and shows where actual spending is drifting. The important word is properly. A static template can break when income changes or housing consumes most of the budget, so this guide builds in locked formulas, category checks, averaging, and floor-budget switches.
Why a 50/30/20 Spreadsheet Beats Guessing Every Month
The 50/30/20 framework became popular after Senator Elizabeth Warren and Amelia Warren Tyagi presented it in their 2005 book All Your Worth: The Ultimate Lifetime Money Plan. Their idea was deliberately simple, divide after-tax income into 50% needs, 30% wants, and 20% savings or debt repayment, rather than forcing every household to maintain a giant line-item ledger.
That simplicity matters on payday. Suppose your take-home pay lands in your account and you know rent is due, but you don't know how much room remains for food, transport, entertainment, or extra debt payments. A spreadsheet turns the decision into visible targets instead of a monthly guessing contest. Enter income once, and the file produces category ceilings for the month, pay period, and year.
The spreadsheet payoff
A good sheet answers three questions immediately:
- What can I spend on essentials? The needs ceiling gives housing, utilities, groceries, transportation, insurance, and minimum debt payments a shared limit.
- How much flexibility do I have? The wants target separates discretionary spending from obligations.
- What gets protected first? The final bucket assigns money to emergency savings, investing, retirement contributions, or above-minimum debt payments.
The method works across monthly, biweekly, and weekly planning because it uses proportions rather than fixed dollar thresholds. Budgeting tools favor it for the same reason. The math is simple enough to automate while still producing concrete savings and debt-paydown targets.
Practical rule: Start with take-home pay. Gross income is useful for understanding compensation, but it isn't the cash available for ordinary spending.
A spreadsheet also makes annual planning less abstract. It can show the monthly target beside the annual equivalent, so a temporary overspend becomes visible before it turns into a pattern. If you're working on building personal wealth in 2026, this kind of repeatable system is more useful than a motivational promise to “be better with money.”
For readers comparing planning styles, a budget planner can help you decide whether this percentage framework fits better than a more detailed approach. My view is straightforward: use 50/30/20 as the default dashboard, then customize it when your income or fixed costs make the default unrealistic.
How the 50/30/20 Rule Divides Your Take Home Pay
The rule starts with after-tax income, meaning the money you have available after taxes and other payroll deductions. That choice keeps the calculation grounded in spendable cash and lets the same structure work for different pay frequencies.
For every 100 units of take-home income, the allocation is:
- 50 units for needs, including housing, basic groceries, transportation, insurance, utilities, childcare, and minimum debt payments.
- 30 units for wants, such as dining out, entertainment, hobbies, subscriptions, travel, and nonessential shopping.
- 20 units for savings and debt repayment, including emergency funds, retirement contributions, investments, and payments above required minimums.
A clear monthly example
With monthly take-home income of $4,000, the targets are:
| Bucket | Calculation | Monthly target | Annual target |
|---|---|---|---|
| Needs | $4,000 × 0.50 | $2,000 | $24,000 |
| Wants | $4,000 × 0.30 | $1,200 | $14,400 |
| Savings and debt repayment | $4,000 × 0.20 | $800 | $9,600 |
The annual figures multiply the monthly targets by twelve. They don't predict your income, and they don't excuse an expensive month. They give you a longer view, which helps distinguish a one-time bill from permanent category drift.
The 20% bucket deserves careful labeling. Calling it “savings” can make borrowers overlook extra debt payments, while calling it “debt” can make savers forget emergency funds and investing. Use a label such as future security, then track its subcategories separately.
Your needs classification should be honest, not aspirational. A required payment belongs with needs, while an optional extra payment belongs in future security. If housing, childcare, or debt obligations make the needs target impossible, the spreadsheet should show that clearly rather than hiding the shortfall. A broader explanation of ratios can help when you're evaluating obligations alongside income, including this personal finance ratios guide.
The framework is a starting allocation, not a financial law. Its value comes from making tradeoffs visible.
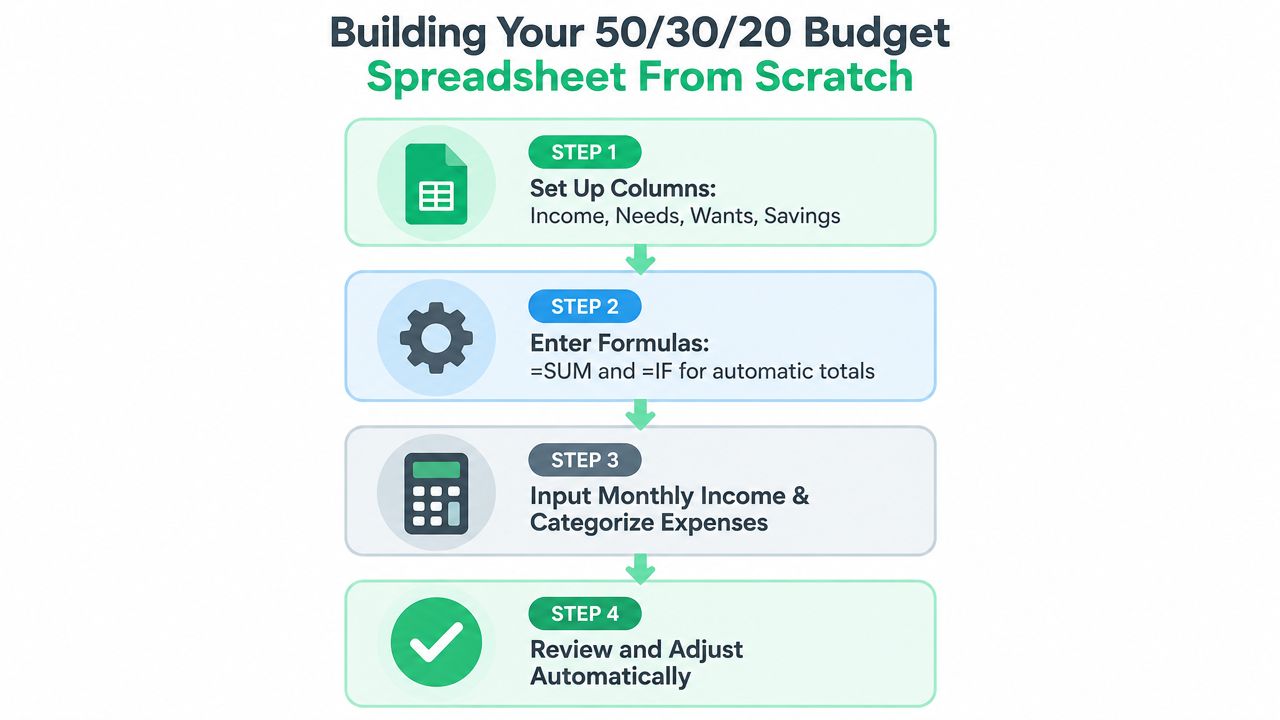
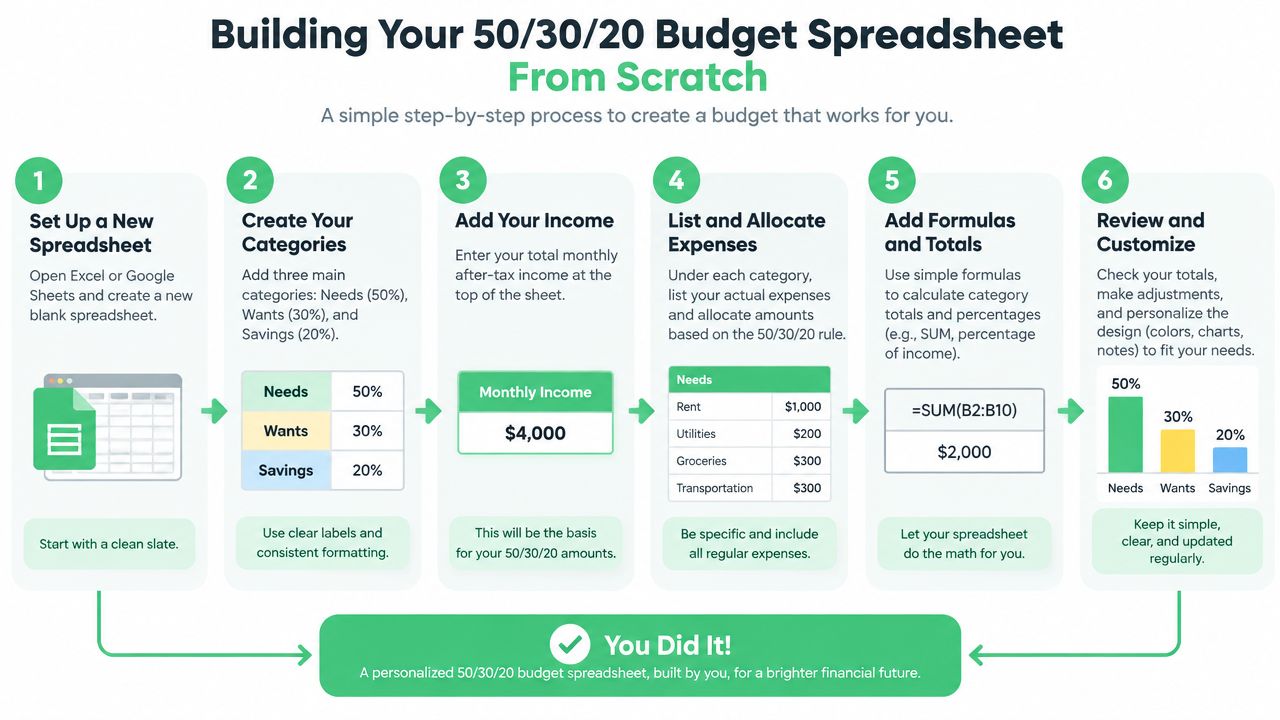
Building Your 50/30/20 Budget Spreadsheet From Scratch
Build the file so the formulas do the repetitive work and you do the judgment calls. A spreadsheet that depends on manually retyping targets every month is a calculator wearing a spreadsheet costume.
Set up the workbook
Create three sheets:
- Inputs, for take-home income, selected split, and assumptions.
- Transactions, for date, description, amount, and category.
- Dashboard, for targets, actual totals, differences, and warning flags.
On the Inputs sheet, place monthly take-home income in a clearly labeled cell. Give that cell a name such as Income, then create three target cells using these formulas:
- Needs target:
=Income*0.5 - Wants target:
=Income*0.3 - Future security target:
=Income*0.2
If your spreadsheet doesn't support named cells, use a direct reference such as =B2*0.5, assuming B2 contains income. Named cells are easier to read and reduce mistakes when you later add a variable-income switch.
The basic difference formula is equally important:
=Target-Actual
A positive result means room remains under the target. A negative result means actual spending has exceeded it. Add conditional formatting so negative differences turn visibly red and positive differences use a calmer color. The formula pattern and difference column are also described in this spreadsheet construction guide.
Build useful categories
Use a controlled category list rather than typing classifications from memory. Your Transactions sheet might include:
| Expense | Bucket | Example subcategory |
|---|---|---|
| Housing | Needs | Rent or mortgage |
| Transport | Needs | Fuel, transit, repairs |
| Subscriptions | Wants | Streaming or memberships |
| Debt minimum | Needs | Required payment |
| Extra debt payment | Future security | Above-minimum payment |
| Emergency fund | Future security | Cash reserve contribution |
Add a dropdown to the Bucket column with only Needs, Wants, and Future security. This prevents “want,” “wants,” and “Want” from becoming three separate categories that the SUMIF function treats differently.
On the Dashboard, calculate actual totals with formulas such as:
=SUMIF(Transactions!B:B,"Needs",Transactions!C:C)=SUMIF(Transactions!B:B,"Wants",Transactions!C:C)=SUMIF(Transactions!B:B,"Future security",Transactions!C:C)
Then place each actual total beside its target and add the difference formula. Include a total check, such as actual needs plus actual wants plus actual future security, compared with total entered transactions. If those numbers don't match, the file should flag an uncategorized or incorrectly entered transaction.
Lock the parts that matter
Protect formula cells and leave only input cells editable. Add an assumptions box stating that the plan uses take-home income, required debt payments count as needs, and extra debt payments count as future security. These small notes prevent future-you from “fixing” the sheet by changing a formula you no longer remember.
You can also add a validation flag:
=IF(OR(B2="Needs",B2="Wants",B2="Future security"),"OK","CHECK CATEGORY")
The exact cell references will vary, but the principle is stable. The file should complain immediately when a category falls outside the approved list. For practical help reviewing labels and recurring expenses, these expense categorization tips can help you create cleaner line items.
Finally, duplicate the Dashboard for each month or add a month column to Transactions. For biweekly or weekly pay, enter the income for the relevant period, or convert it into a consistent monthly planning figure before applying the percentages. Don't maintain separate formulas by hand. One income input should drive every target.
Customizing the Spreadsheet for Variable Income and High Costs
A static 50/30/20 sheet assumes income behaves politely. Freelance income, commissions, seasonal work, and irregular contracts rarely do. High-cost housing creates a second problem, because a household can classify expenses correctly and still find that required needs exceed the classic target.
The fix is a switchable model, not abandonment of the framework.
Add a variable-income switch
Create an income input for each of the most recent three months, then calculate the average:
=AVERAGE(B2:D2)
Use that average as the planning income when pay fluctuates. The purpose is to smooth a lumpy month, not to inflate your expected cash flow. If the current month falls below the average, the sheet should protect needs first.
Add a minimum-needs floor. Let MinimumNeeds represent the amount required for housing, utilities, basic food, transport, insurance, and minimum debt payments. Then calculate the needs target with a switch:
=IF(CurrentIncome*0.5<MinimumNeeds,MinimumNeeds,CurrentIncome*0.5)
If income is below plan, wants should be the first flexible category. A simple leftover formula can direct remaining cash after the needs floor:
=MAX(0,CurrentIncome-ActualNeeds)
You can split that leftover between wants and future security according to your chosen priorities. During a lean month, the wants allocation may fall sharply while required expenses remain funded. During a stronger month, the spreadsheet can restore the normal targets and send excess money toward savings or debt.
Model expensive fixed costs openly
For high-cost housing, add an actual essentials ratio:
=ActualNeeds/TakeHomeIncome
Compare that result with the classic 50% needs target on the Dashboard. If the ratio is higher, don't force groceries or childcare into “wants” to make the chart look tidy. Use a realistic alternative split and label it clearly.
| Situation | Recommended split | Spreadsheet adjustment |
|---|---|---|
| Standard costs and stable income | 50/30/20 | Use fixed targets from take-home income |
| High housing or childcare costs | 60/20/20 | Increase needs target and reduce wants |
| Needs consume most available cash | 70/20/10 | Protect essentials, retain a smaller future-security target |
| Variable income | Use an averaged baseline | Add a three-month average and minimum-needs floor |
These alternatives are planning choices, not universal rules. The right split is the one that reflects actual obligations while preserving some progress toward future security. A household with high rent may need a 60/20/20 structure for a period, while a household with a temporary debt emergency may choose to reduce wants and increase future security.
Create separate sinking-fund lines for irregular needs, such as annual insurance, repairs, gifts, or travel. A guide to sinking fund categories can help you keep those expenses from ambushing the monthly plan.
The spreadsheet should show two views: classic target and custom target. That preserves the original benchmark while making the current household reality visible.
Tips to Keep Your Spreadsheet Accurate and Mistake Free
A budget can fail because the plan is wrong, but spreadsheet mechanics cause plenty of avoidable trouble. Budgeting is widely used, and Debt.com's 2026 survey reports that 84.67% of Americans budget while 87.67% of budgeters say budgeting helped them get out of debt or stay out of it. The lesson isn't that every spreadsheet works. It's that a usable system can support debt control when the data stays trustworthy.
Spreadsheet-budgeting research cited by Planful reports data-integrity issues at 54%, version-control issues at 45%, hidden-calculation issues at 41%, and output errors at 37%. Those figures point to practical safeguards.
| Common failure | Better control |
|---|---|
| Needs and wants are classified inconsistently | Use dropdown categories and written assumptions |
| Formulas are overwritten | Lock formula cells and shade editable cells |
| Multiple copies circulate | Keep one master file and a dated backup |
| Hidden calculations distort totals | Put assumptions and helper formulas on a visible sheet |
| Actuals don't reconcile | Add a total check against entered transactions |
| Overspending appears only at month-end | Use conditional formatting and live difference flags |
Run a short audit
At each review, check that income matches the amount received, transactions have valid dates, and every amount appears once. Confirm that the three bucket totals reconcile with the transaction list, then scan negative difference cells.
Don't wait until the final day of the month to discover that a subscription was classified as savings or that a transfer was counted as spending. Continuous flags turn errors into small corrections instead of archaeological digs through old statements.
Keep the source data simple. One row per transaction, one approved bucket, one amount, and one month. Protect the dashboard, document the assumptions, and save a clean copy before making structural changes.
Putting Your 50/30/20 Spreadsheet to Work Every Payday
The finished spreadsheet should become a routine, not a decorative file you admire once and abandon beside an old meal plan.
Use this payday workflow:
- Enter actual take-home income.
- Check the three-month average if income varies.
- Confirm the needs floor covers required obligations.
- Record transactions using the approved dropdown categories.
- Review target-versus-actual differences.
- Automate the future-security transfer and extra debt payment.
- Adjust wants when income or fixed costs require it.
The classic 50/30/20 split is a strong starting point because it scales with income and keeps future security visible. It shouldn't override reality. High housing costs, childcare, student debt, or irregular pay justify a custom split, provided the spreadsheet shows the tradeoff.
Use the sheet every payday, not just when money feels tight. The best improvement usually comes from automating the 20% future-security bucket first, then spending what remains with clearer boundaries.
Get more posts like this
One short, useful email each Friday. Free, no spam, unsubscribe anytime.